Online Behavior
Average Monthly Spending On Mobile Games By Segment, February 2014 [CHART]
The smartphone gaming audience will see faster growth in 2014 and all the way through 2018.
Read MoreGlobal Mobile Gaming Revenues By Device, 2013-2017 [CHART]

Mobile game revenues will rise 42% year over year to hit $25.0 billion in 2014. Next year, the total will come in at $30.3 billion.
Read MoreMillennial Content Sharing By Category & Channel, April-July 2014 [CHART]
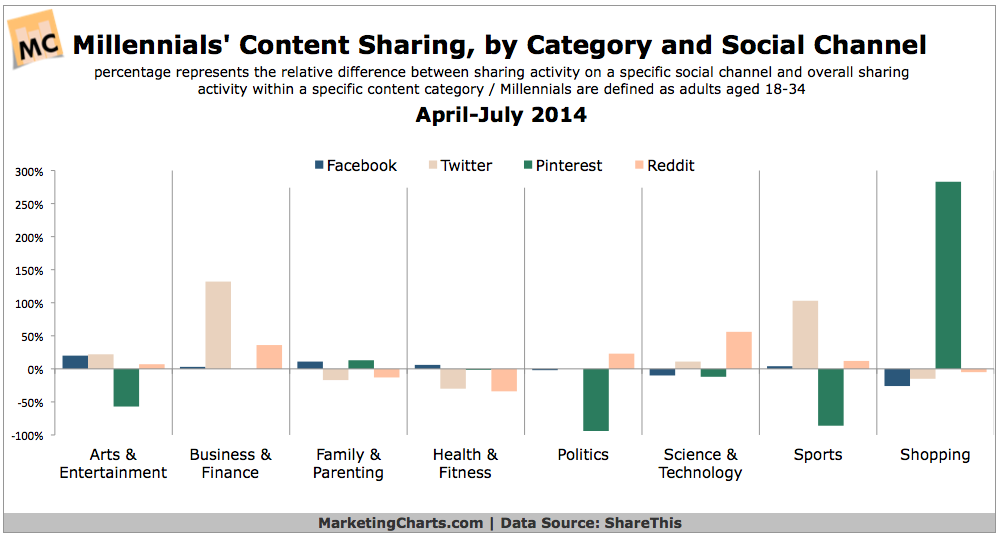
Millennials (18-34) are far more likely than the general population to share content on social networks and to click on shared content.
Read MoreEmail Open & Click-Through Rates, 2010-2014 [CHART]
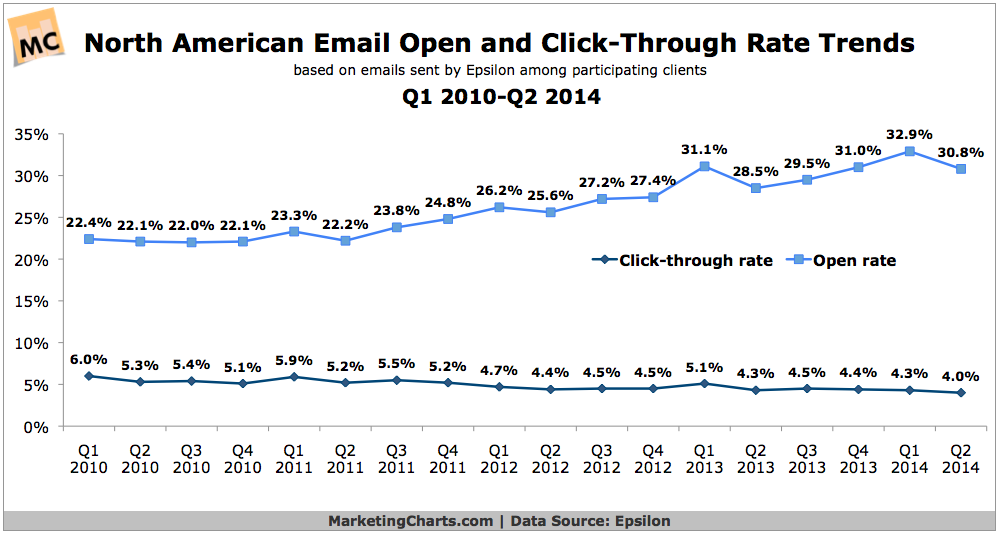
Email open rates declined on a quarter-over-quarter basis in Q2 to 30.8%, although they remain up from the year-earlier period (28.5%).
Read MoreThe Life Of A B2B Sales Representative [INFOGRAPHIC]

This infographic from Qvidian illustrates the life and struggles a B2B sales representatives face on the job.
Read MoreEffect That Social TV Has On TV Show Follower Growth, September 2014 [CHART]
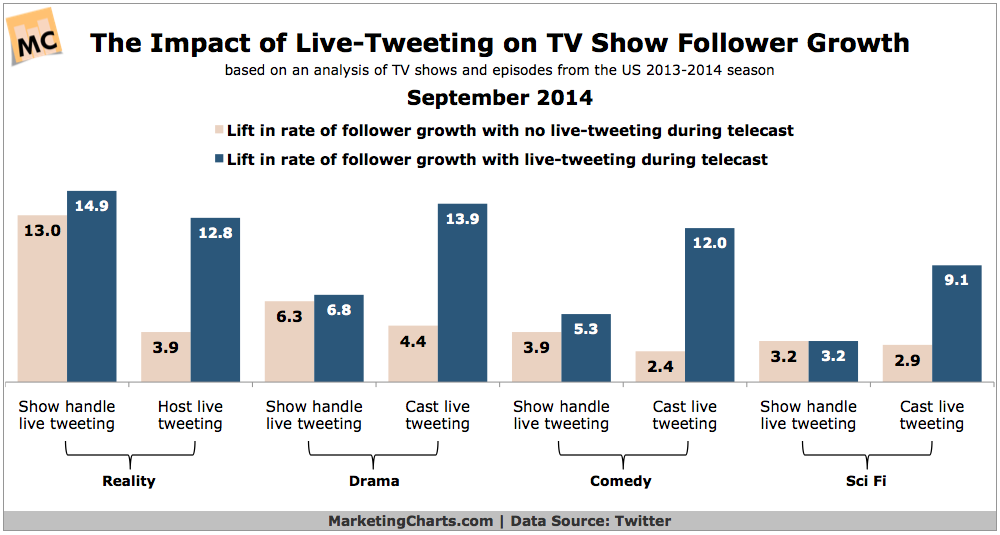
TV shows that live-tweet have a better follower growth rate than those that don’t.
Read MoreOffers In Retail Mobile Ads To Which Users Are Likely To Respond, June 2014 [CHART]
Mobile users were most likely to engage with mobile retail ads before they shopped, cited by 73% of respondents.
Read MoreAverage Lead Time For Researching Retail Products via Mobile, June 2014 [CHART]
81% of US mobile users turned to their devices to research retail items at home or work—meaning before heading to a brick-and-mortar—while 19% engaged with mobile during a shopping trip.
Read MoreMobile Website Traffic Share By Browser, April 2014 [CHART]
Apple devices excluding tablets accounted for 51.6% of mobile internet traffic in Q2 2014.
Read MoreMobile Website Traffic Share By Device & Brand, June 2014 [TABLE]
The majority of US mobile website traffic on smartphones in June 2014 came from Apple devices, with a 54% share.
Read More