Mobile Marketing
Phablet User Persona [CHART]

Compared to the average mobile user, Phablet users over-index in the Social Influencer Persona by 2.4x.
Read MoreTime Spent On Books By Device Type, 2013 vs 2014 [CHART]
Phablet users behave a lot like consumers on smaller devices, with gaming, social and entertainment as the leading app categories.
Read MoreAndroid Users By Device Type, 2013 vs 2014 [CHART]
iOS only recently offered a Phablet, so Flurry looked through an Android-only lens to get a clearer idea of how Phablets are faring.
Read MoreMobile App Sessions By Device Type, 2013 vs 2014 [CHART]
Phablets command a disproportionate share of app activity.
Read MoreActive Mobile Use By Device Type, 2013 vs 2014 [CHART]
Over the course of a year, the installed base for Phablets doubled.
Read MoreMarket Share Of Mobile Device Types, 2013 vs 2014 [CHART]
In 2013, a mere 2% of the kinds of devices Flurry saw were Phablets, whereas in 2014, Phablets represent 10% of all device types.
Read MoreHow Moms Will Use Mobile For Back-To-School Shopping, July 2014 [CHART]
63% of US mothers with children under the age of 18 planned to use their smartphones while back-to-school shopping.
Read MoreShare Of Time Spent With Smart Phone Apps, June 2014 [CHART]
Mobile’s share of digital consumption continues to grow, with apps hogging more mobile time on smartphones (88% share) than tablets (82%).
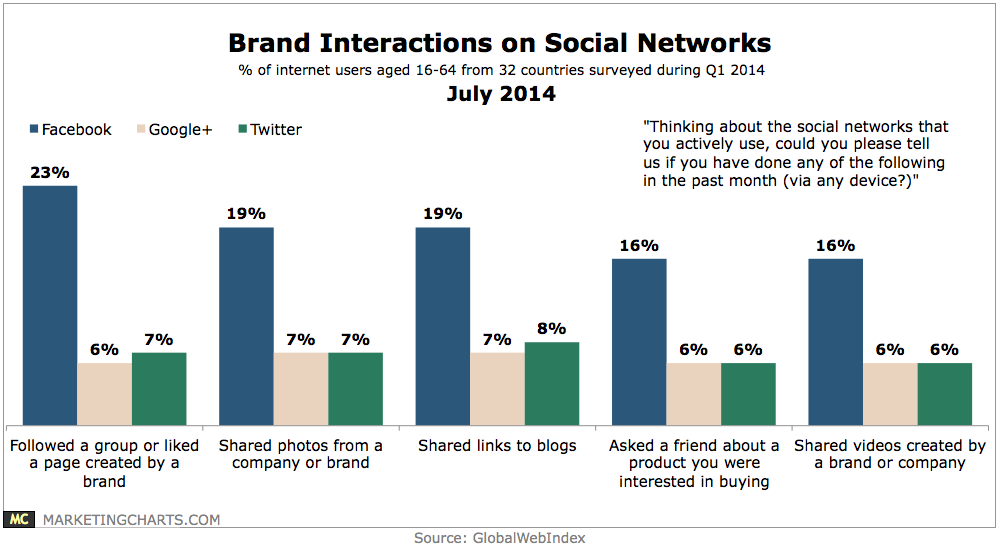
Read MoreFortune 500 Social Media Use, 2012-2014 [CHART]
Social media use is almost ubiquitous among the Fortune 500 and newer platforms are seeing fast-rising adoption rates.
Read MoreWhy Consumers Would Use A Wearable Health/Fitness Device, March 2014 [CHART]
81% of US internet users said they would use a wearable health or fitness device.
Read More