Mobile Marketing
Italian Multitainment Activities, November 2013 [CHART]
Almost half (46.3%) of Italian smart phone users who used their phone for any activity related to a TV program said they visited social networks.
Read MoreGoogle+ Is NOT Dead & Video Meets Commerce [VIDEO]

David Erickson & BL Ochman discuss rumors of Google+’s imminent demise, touchable videos, the NYPD’s Twitter storm and more on the Beyond Social Media Show.
Read MoreLocal Search Conversions By Device, April 2014 [CHART]
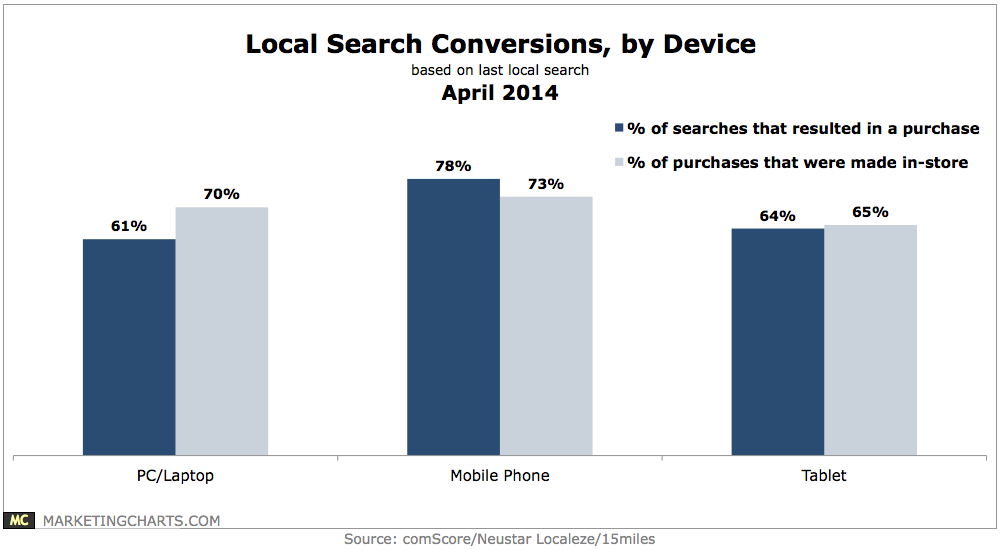
Some 78% of local searches conducted on a mobile phone result in a purchase, and 73% of those purchases are made in-store.
Read MoreUS Mobile Local Ad Spending By Format, 2013-2018 [TABLE]
Search and social were among the top among formats, with search claiming the majority of location-targeted mobile ad spending through 2018.
Read MoreUS Local vs. National Mobile Ad Spending, 2013-2018 [CHART]
Berg Insight predicted that ad revenues from social networking and local search would drive mobile local ad spending.
Read MoreNorth American Mobile Location-Based Services Revenues, 2013 & 2018 [CHART]
60% of mobile users now accessing LBS at least monthly.
Read MoreGlobal Mobile App Use, March 2013-March 2014 [CHART]
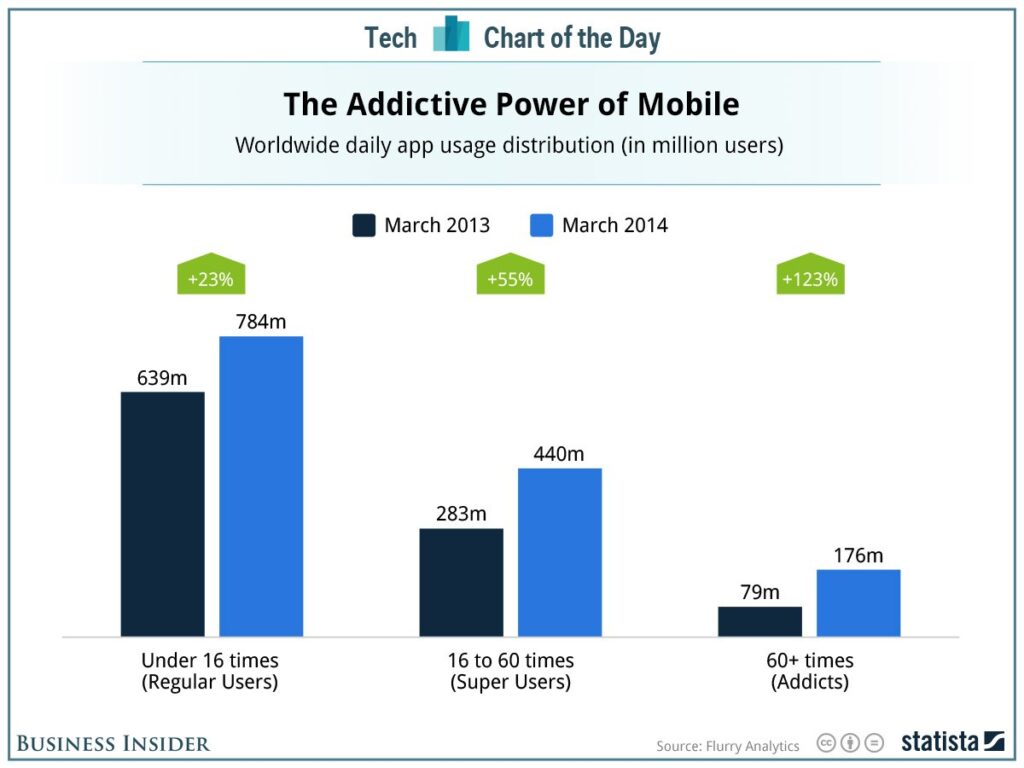
On average, Flurry says a user launches an app 10 times a day.
Read MoreiPad Revenue During The Past Year [CHART]
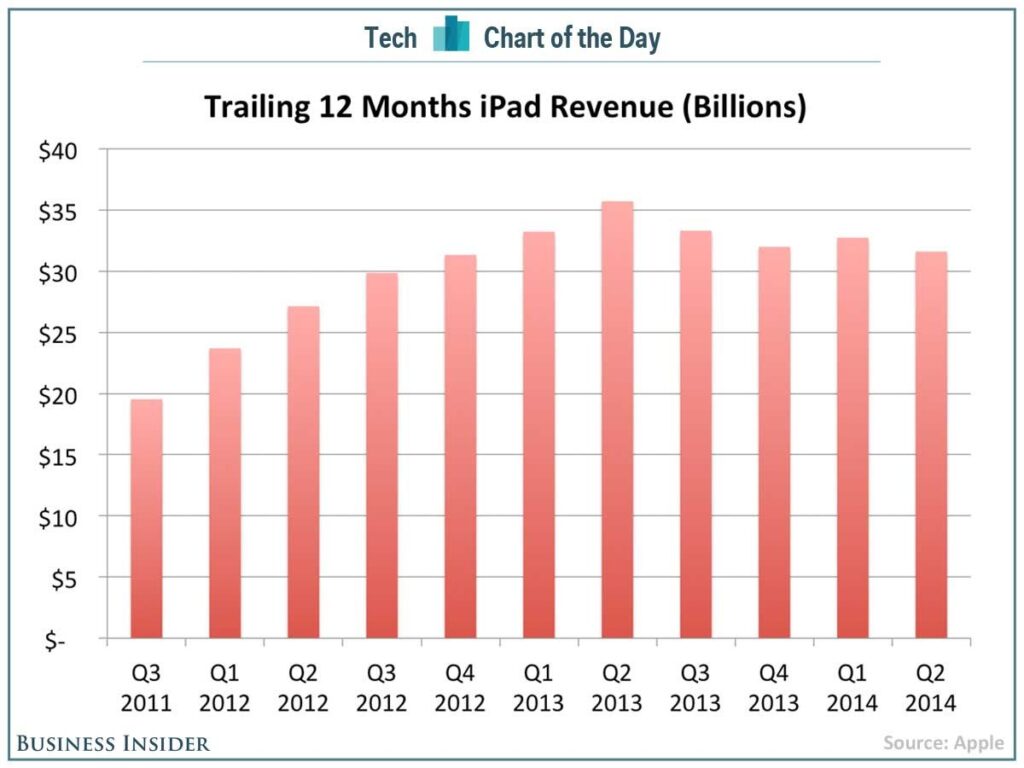
iPad sales were surprisingly bad. They totally missed analyst expectations and were down 16% on a year-over-year basis.
Read MoreRadio Listening Platforms, 2013 vs 2014 [CHART]
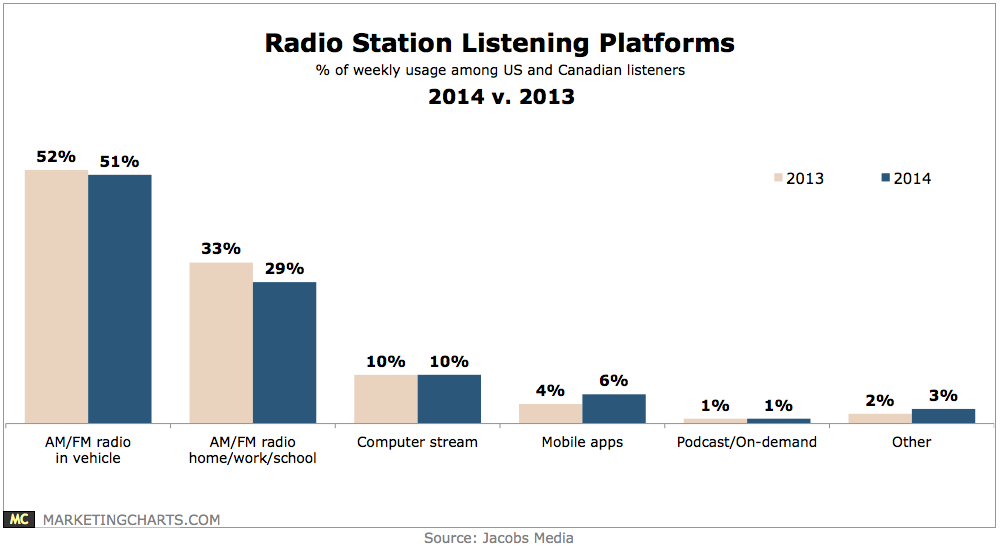
Almost one-fifth of weekly radio usage in the US and Canada now occurs on digital sources.
Read MoreMobile Share Of US Organic Search Visits, Q2 2012 – Q1 2014 [CHART]

Mobile’s 33% of Google search visits in Q1 2014 represented only a slight uptick from Q4 2013 (32%), but a more robust rise from 27% share during the year-earlier period.
Read More