Mobile Behavior
Mobile App Store Market Share By Category, February 2014 [TABLE]
Games claimed 41.2% of all Google Play device installs, compared with 7.6% for second-place communication.
Read MoreAmericans' Time Spent On Mobile Internet By Category, Q1 2014 [TABLE]
When it comes to time spent using the mobile internet, apps continue to grab an overwhelming majority of US consumers’ time.
Read MoreUS Small Business Mobile Websites, December 2013 [CHART]
70% of SMBs with websites had ones that were not mobile-optimized.
Read MoreWestern European Smart Phone Users By Country, 2012-2017 [TABLE]
eMarketer estimates that 22.3 million people in Spain will use a smartphone this year—and the number will reach 26.0 million in 2015, or nearly 54% of the population.
Read MoreWhen Twitter Users Tweet About Television Shows, January 2014 [CHART]
Those who do use social with TV don’t just do so during a live broadcast.
Read MoreMobile Payment Transaction Share In China By Type, 2010-2017 [TABLE]
Payments made via text message accounted for just 6.1% of mobile payment transactions in China during 2013, down from 92.5% in 2010.
Read MoreMobile Payment Transactions In China, 2010-2017 [CHART]
Third-party mobile payment services in China achieved a total transaction volume of RMB1.22 trillion ($197.09 billion) in 2013, a 707.0% year-over-year increase.
Read MoreTime American Executives Spend Streaming Live Video By Device, 2013-2017 [TABLE]
While 47% of executives said their online video usage had stayed the same since 2010, nearly the same percentage had increased usage during the timeframe.
Read MoreTop Social Platforms’ Multi-Platform Reach By Device, December 2013 [CHART]
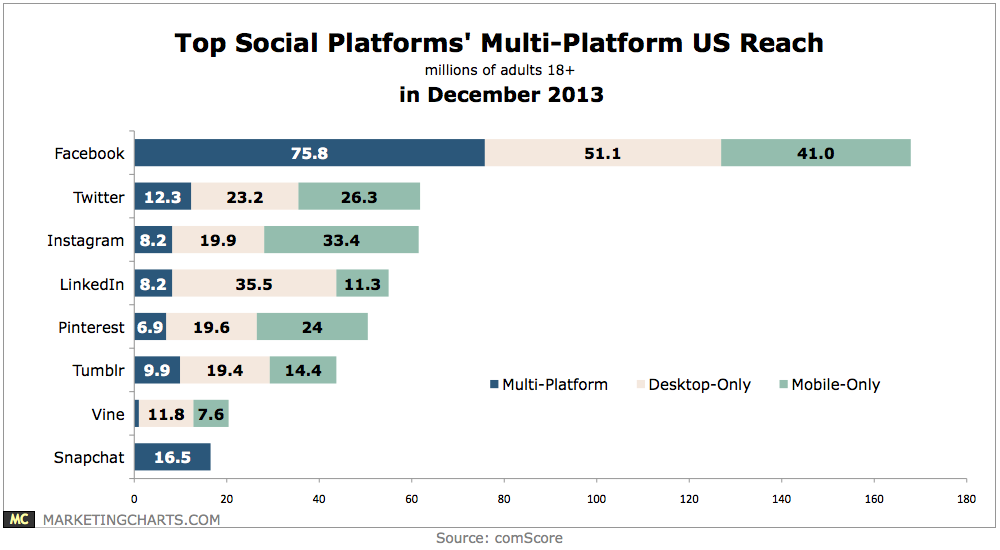
Twitter and Instagram are closely matched in total reach, a finding that makes sense given a recent report from the Pew Research Center indicating that a majority of Twitter users also use Instagram.
Read MoreAmericans' Small-Ticket Purchase Cutbacks, April 2014 [CHART]
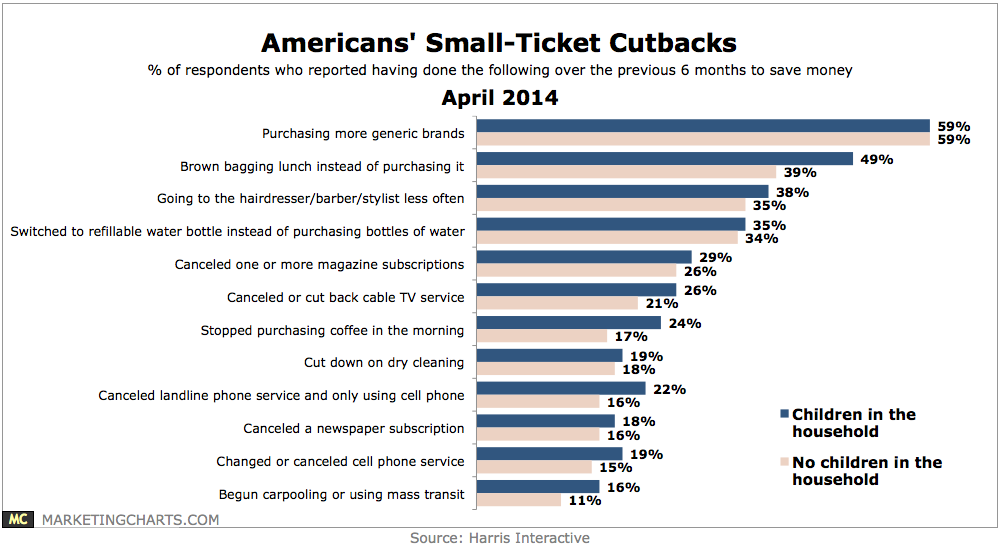
Parents are also more likely than those without children in the household to decrease their spending in a variety of areas, including restaurants (64% vs. 56%) and entertainment (60% vs. 51%).
Read More