Mobile Behavior
iPad Revenue During The Past Year [CHART]
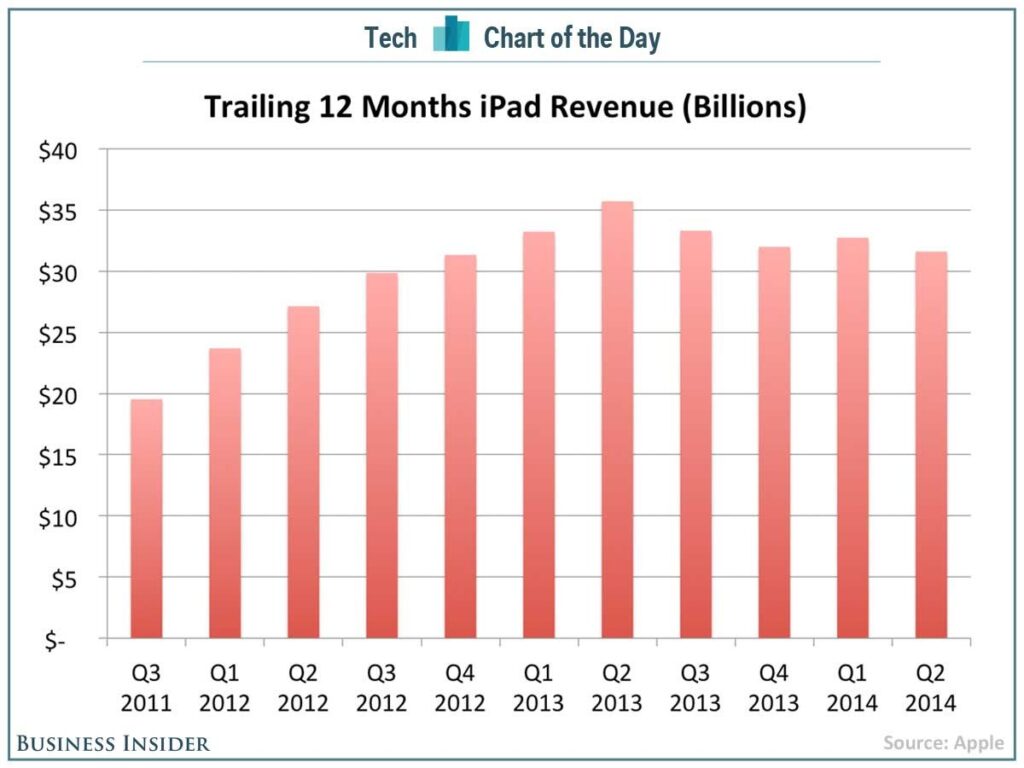
iPad sales were surprisingly bad. They totally missed analyst expectations and were down 16% on a year-over-year basis.
Read MoreRadio Listening Platforms, 2013 vs 2014 [CHART]
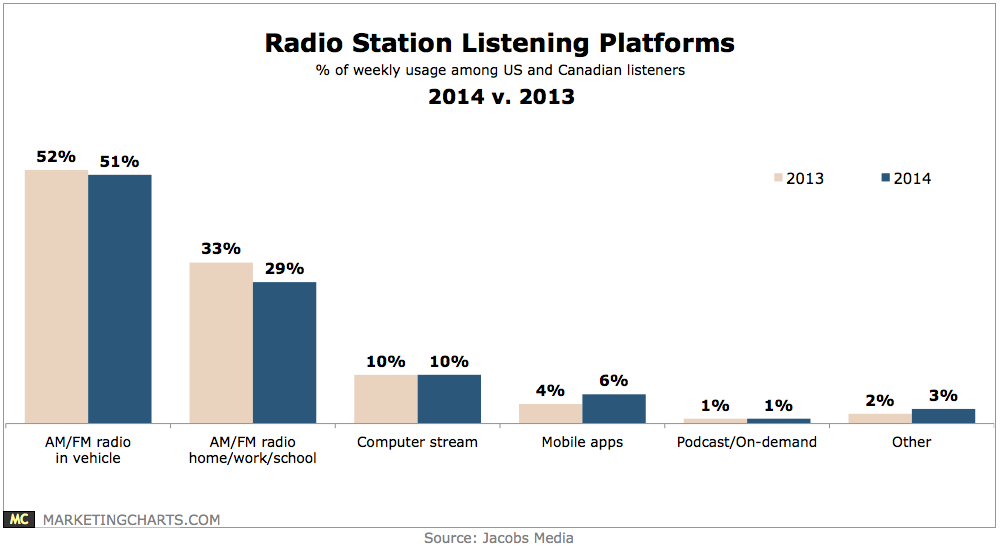
Almost one-fifth of weekly radio usage in the US and Canada now occurs on digital sources.
Read MoreMobile Share Of US Organic Search Visits, Q2 2012 – Q1 2014 [CHART]

Mobile’s 33% of Google search visits in Q1 2014 represented only a slight uptick from Q4 2013 (32%), but a more robust rise from 27% share during the year-earlier period.
Read MoreMobile Germans Who Pay Favorable Attention To Ads By Device, March 2014 [TABLE]
In Germany only 8% to 12% said they favored ads on a smartphone, laptop or tablet but at least 40% said they paid attention to ads on those devices.
Read MoreMobile Spanish Users Who Pay Favorable Attention To Ads By Device, March 2014 [TABLE]
Nearly one-third (31%) of Spanish mobile users said they liked ads on TV, with the percentages for laptops and smartphones at 19% and 14%, respectively.
Read MoreFrench Mobile Users Who Pay Favorable Attention To Ads By Device, March 2014 [TABLE]
In France, 23% said they reacted favorably to ads on TV, while only 10% were well disposed to ads on their smartphones, and 9% welcomed ads on their laptops.
Read MoreLikelihood Of Acting Because Of A Mobile Marketing Message, November 2013 [CHART]
Two-thirds of mobile users who subscribed to marketing messages from brands said they were likely to take action when they saw a pricing-based offer.
Read MoreWhy People Opt-In To Mobile Marketing Messages, November 2013 [CHART]
The No. 1 motivation was to receive special offers and promotions, and the No. 2 slot went to news about other sales.
Read MoreSmart Phone Use While Shopping At Local Business, April 2014 [CHART]
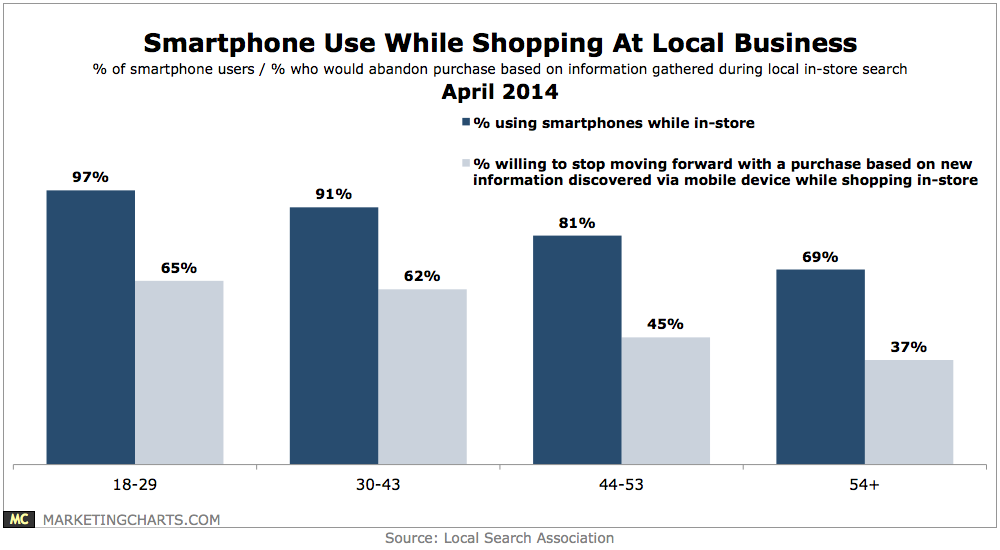
Some 65% of 18-29-year-old smartphone users (and 62% of device users aged 30-43) are willing to stop moving forward with a purchase based on new information they’ve turned up using their mobile device while shopping at a local business.
Read MoreTV Viewing On Alternative Devices, 2012-2014 [CHART]
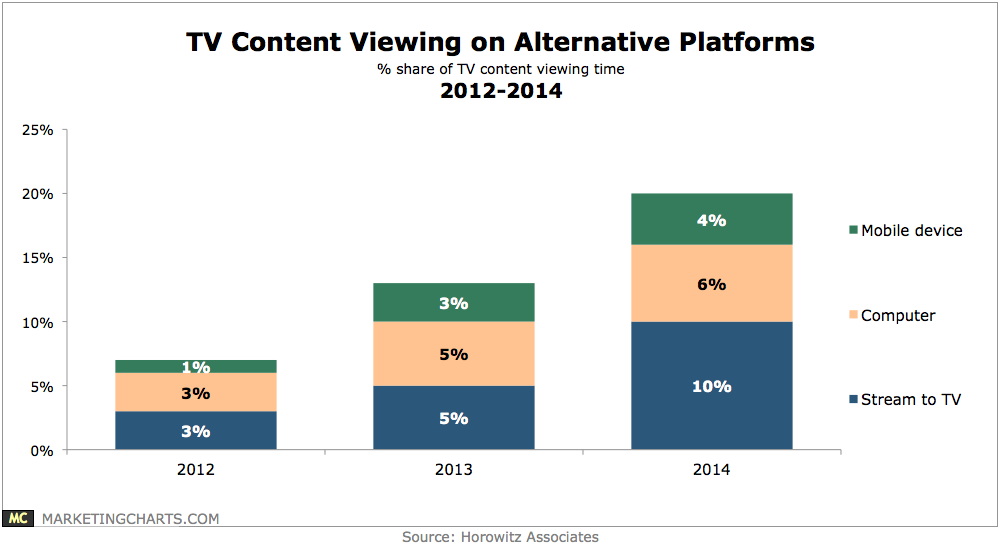
The 20% of TV content viewing time spent on alternative platforms is a significant step up from 13% last year, with the biggest change being for streaming to the TV set (10% this year, up from 5%).
Read More