Mobile Behavior
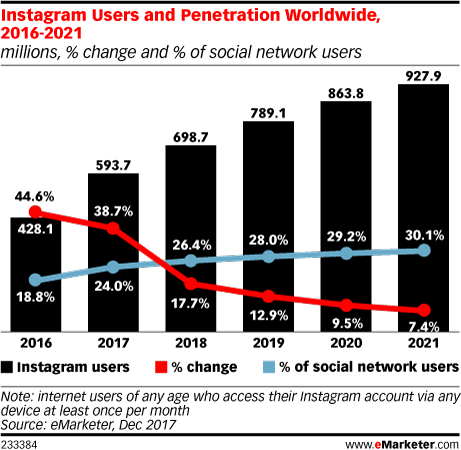
Instagram User Penetration, 2016-2021 [CHART]
One in three people—2.48 billion—worldwide used a social network in 2017, eMarketer estimates. Rising social network use in emerging markets in Asia-Pacific, Latin America and the Middle East and Africa drove an 8.7% gain over 2016.
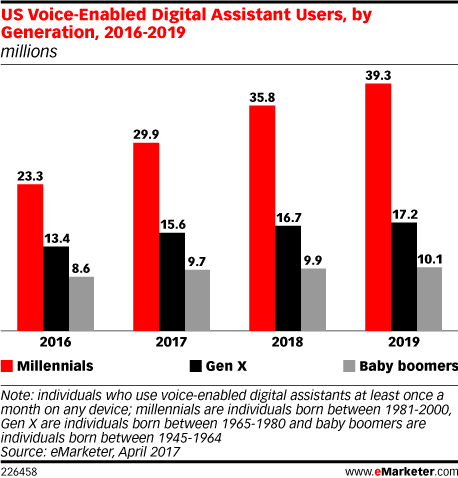
Read MoreVoice Activated Digital Assistant Users By Generation [CHART]
And users of such services are expected to skew young. This year, for example, nearly half of voice-enabled digital assistant users will be millennials, eMarketer estimates.
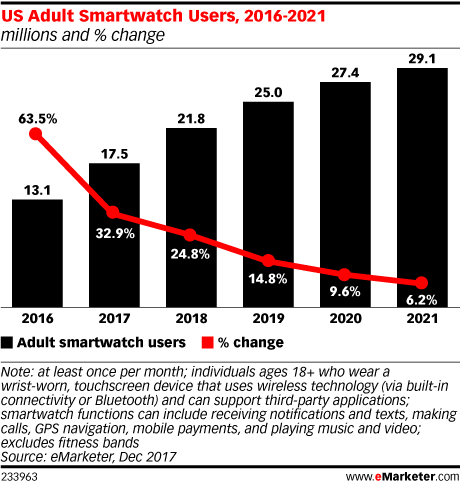
Read MoreUS Smartwatch Users, 2016-2021 [CHART]
In its first breakout of smartwatch users, eMarketer projects the number of US adult smartwatch users will reach 21.8 million in 2018, up 24.8% over 2017.
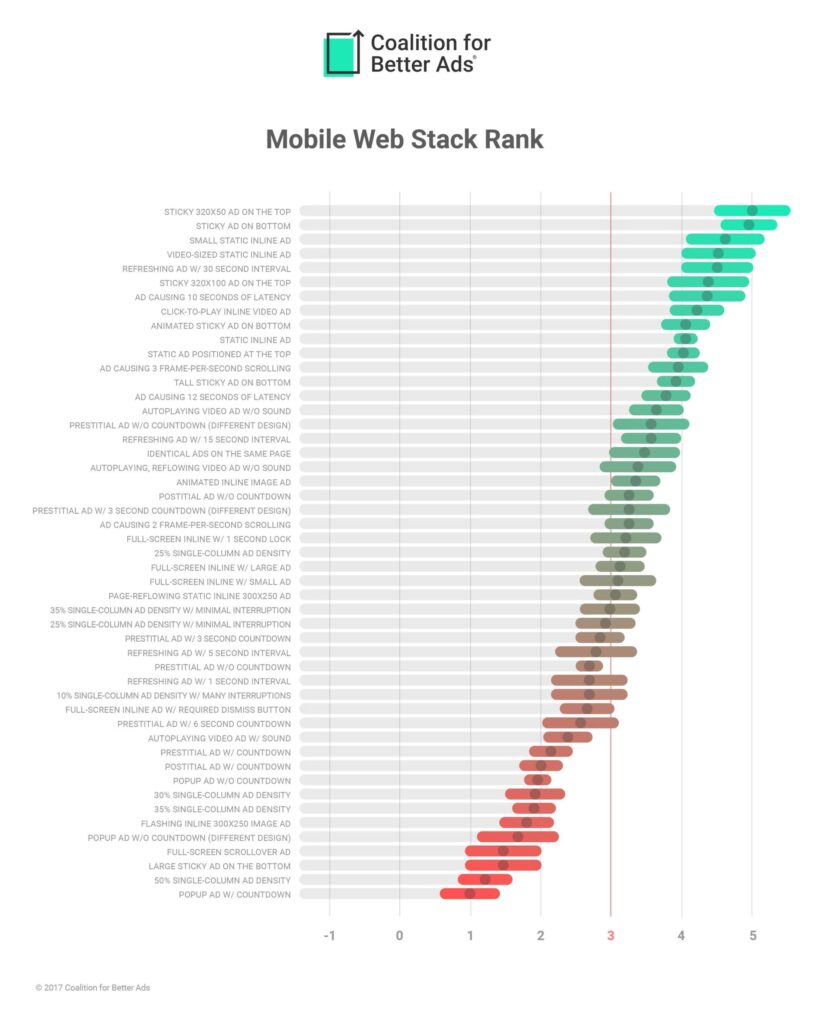
Read MoreMobile Web Ads Ranked From Not-So-Horrible To Worst [CHART]
Based on surveys of 25,000 internet users in North America and Europe conducted by the Coalition (though namely by Google), roughly 85 percent of mobile users surveyed said they found anchor ads only a little annoying or not annoying at all.
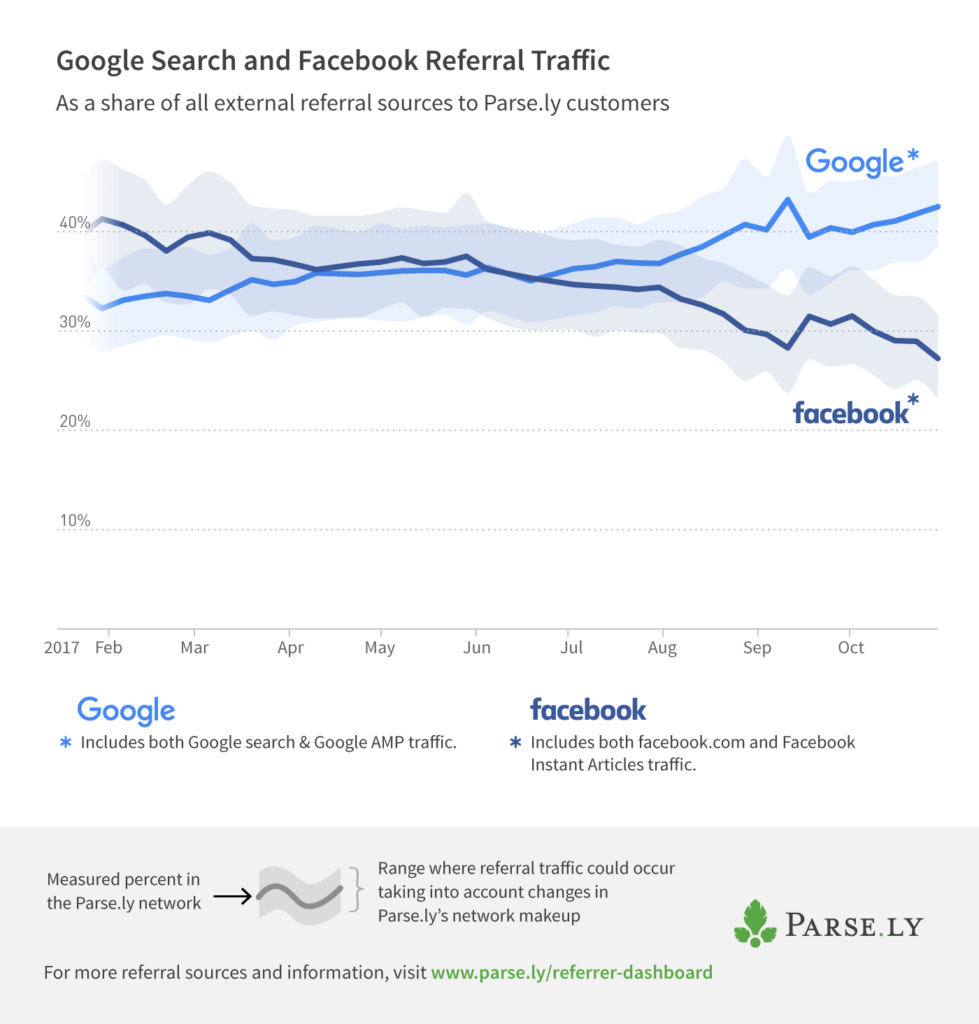
Read MoreGoogle vs Facebook Referral Traffic, 2017 [CHART]
This Parse.ly data reflects the upward trend in referral traffic from Google (all – including AMP – Google’s Accelerated Mobile Pages format) and declining trend in referral traffic from Facebook specifically (all Facebook – including Instant Articles).
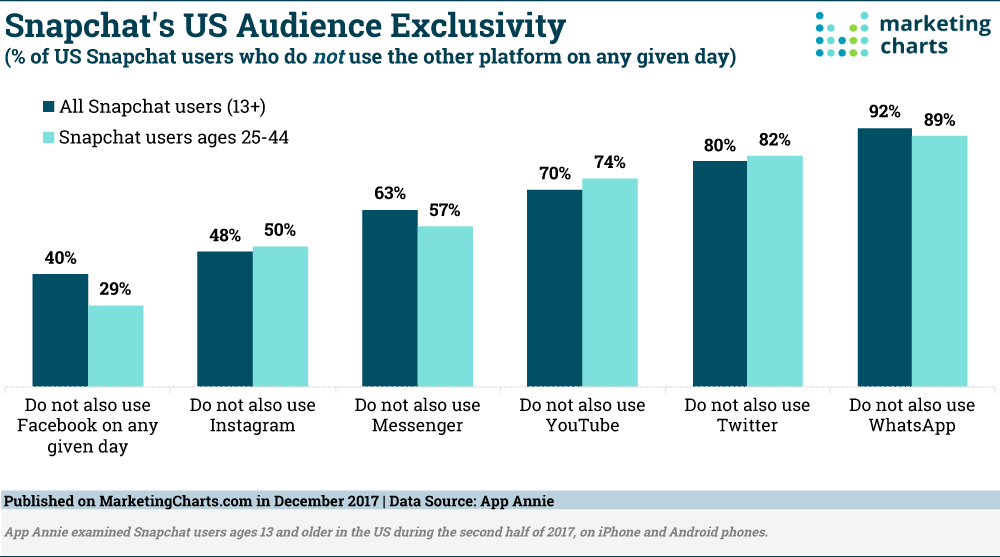
Read MoreSnapchat-Only Users [CHART]
Research has suggested that only about 1 in 10 teen Snapchat users are unique to the platform and not also using Instagram. But to what extent do Snapchat users use other social platforms on a given day?
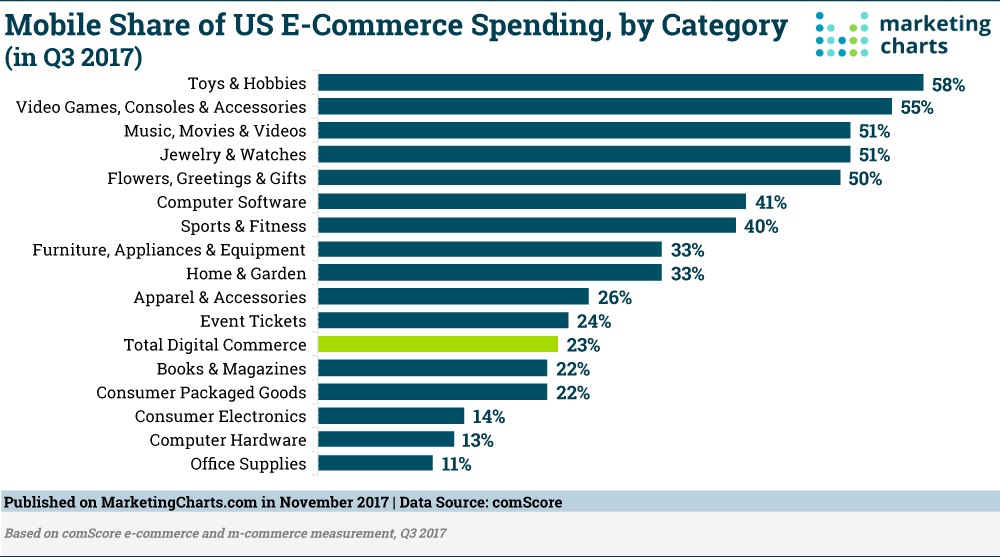
Read MoreMobile Share Of eCommerce Spending By Category [CHART]
Mobile commerce has grown to represent 23% of all digital commerce dollars in the US in Q3 2017. That’s up from 20% share in the year-earlier period, as mobile commerce growth (+40% year-over-year) continues to far outpace desktop e-commerce spending increases (+17%).
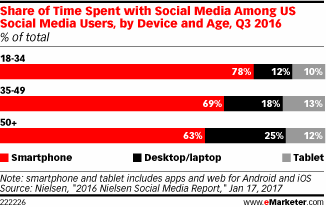
Read MoreTime Spent With Social Media By Generation & Device [CHART]
It’s no surprise that Millennials’ social media time is mainly spent on smartphones. But what about older folks—are Baby Boomers and older users mostly mobile when it comes to social? Turns out, the answer is yes, if not quite to the same extent.
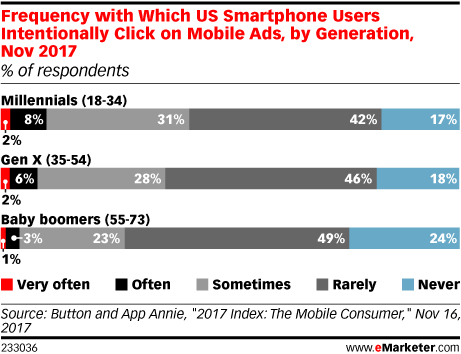
Read MoreIntentional Mobile Ad Clicks By Generation [CHART]
A new survey found that most consumers say they rarely or never mean to click on ads served up on their phones.
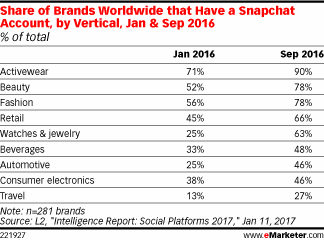
Read MorePercentage Of Brands On Snapchat By Industry [TABLE]
Snapchat has become a must for many brands—especially those aiming to reach young consumers, who are the bulk of Snapchat’s audience. New research found that Snapchat adoption among brands increased throughout 2016, but many of these branded accounts were quickly abandoned.
Read More