Mobile Behavior
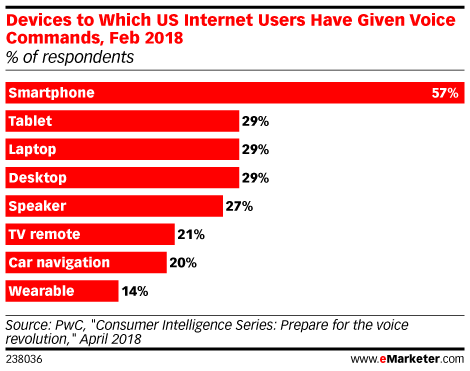
Voice-Activated Device Use [CHART]
eMarketer’s latest forecast expects the number of smart speaker users to rise at a compound annual growth rate (CAGR) of 47.9% between 2016 and 2020, from 16.0 million to 76.5 million.
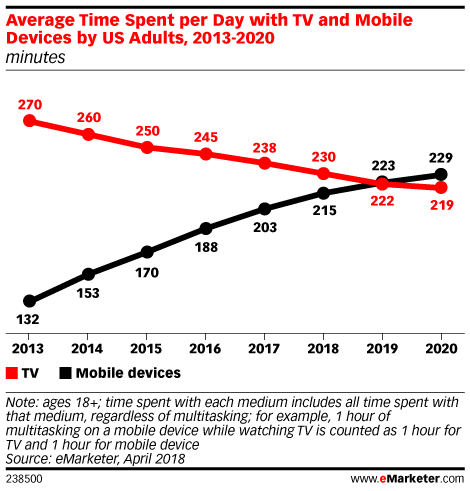
Read MoreTime Spent With Mobile vs Television [CHART]
Americans are spending less time with most major media, with one major exception: smartphones.
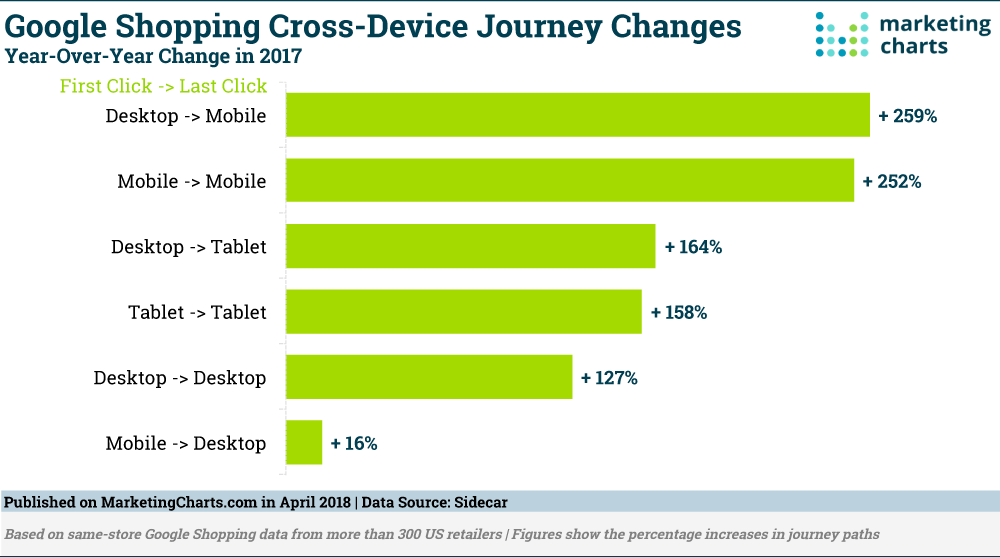
Read MoreCross-Device Shopping Journey Changes [CHART]
US retailers are prioritizing Google Shopping ads over text ads, according to the 2018 Google Shopping Benchmarks Report from Sidecar. Based on an analysis of more than 300 US retailers’ activity in 2017, the report notes that ad spending across Google’s search network grew by 20%, with much greater increases for Google Shopping ads (34%) than for text ads (2%).
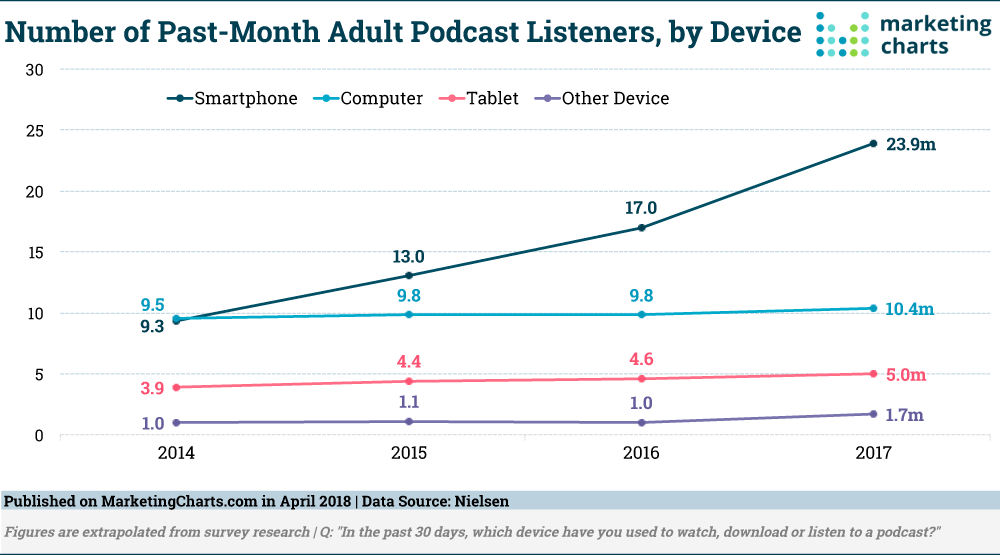
Read MoreRecent Podcast Listeners By Device [CHART]
Podcast awareness and popularity are both on the rise, with a recent study suggesting that 64% of respondents ages 12 and older are familiar with the term ‘podcasting,’ up from 49% three years ago.
Read MoreSmartphone Activities Americans Over 50 [CHART]
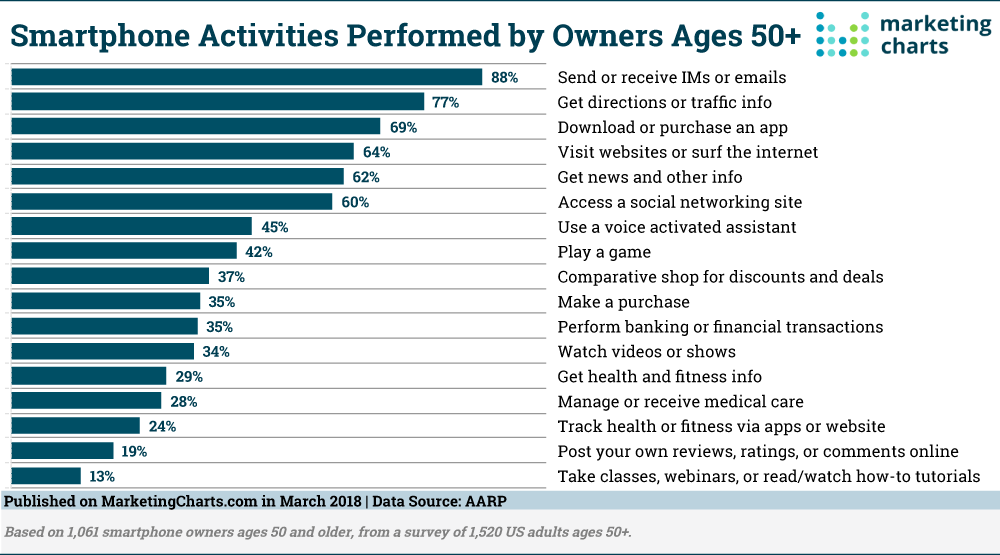
Seven in 10 Americans ages 50 and older own a smartphone, says the AARP in research, and those Americans are most likely to use their devices for messaging.
Read MoreMobile Video Viewers' Frustrations [CHART]
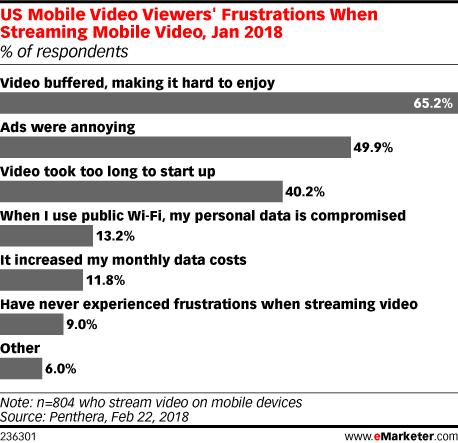
There are few things more frustrating for cord-cutters than getting home from a long day’s work and queuing up their favorite show online as they kick back on the couch, only to realize they can’t watch in peace and harmony because the video won’t load correctly.
Read MoreTop Technologies For Improving The Customer Experience [CHART]
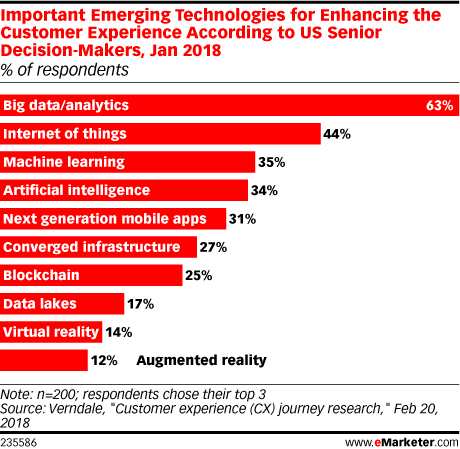
A 2016 study by Forbes Insights and SAS found that 90% of executives worldwide who use data analytics noticed it improved their ability to deliver a superior customer experience. And According to a January 2018 survey of US senior decision-makers conducted by Verndale, big data/analytics was listed as the most important emerging technology for enhancing customer experience, cited by 63% of respondents.
Read MoreMultitainment Users By Device, 2015-2019 [TABLE]
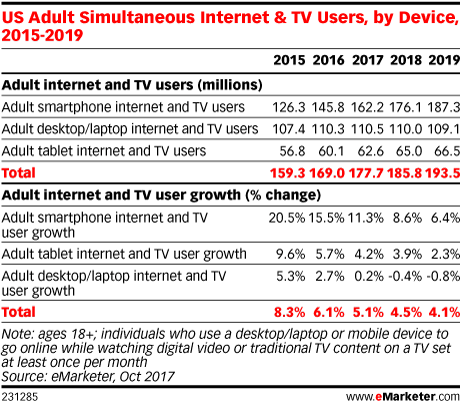
The simultaneous use of second-screen devices—smartphones, tablets and desktops/laptops—while watching TV has increased year to year and will continue through at least 2019.
Read MorePaid Search Clicks From Smartphones, 2014-2017 [CHART]
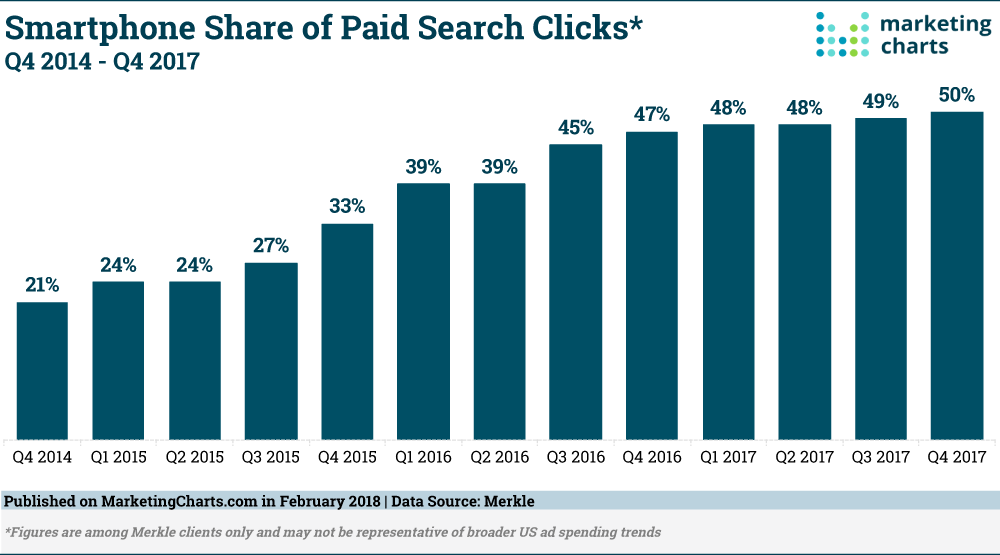
Smartphones have grown to represent half of all paid search clicks during Q4 2017. While smartphones passed that mark on Google a year earlier, they’ve yet to have the same impact on Yahoo and Bing, dragging down their cross-platform average.
Read MoreAmericans' Internet Access By Type, 2012 vs 2017
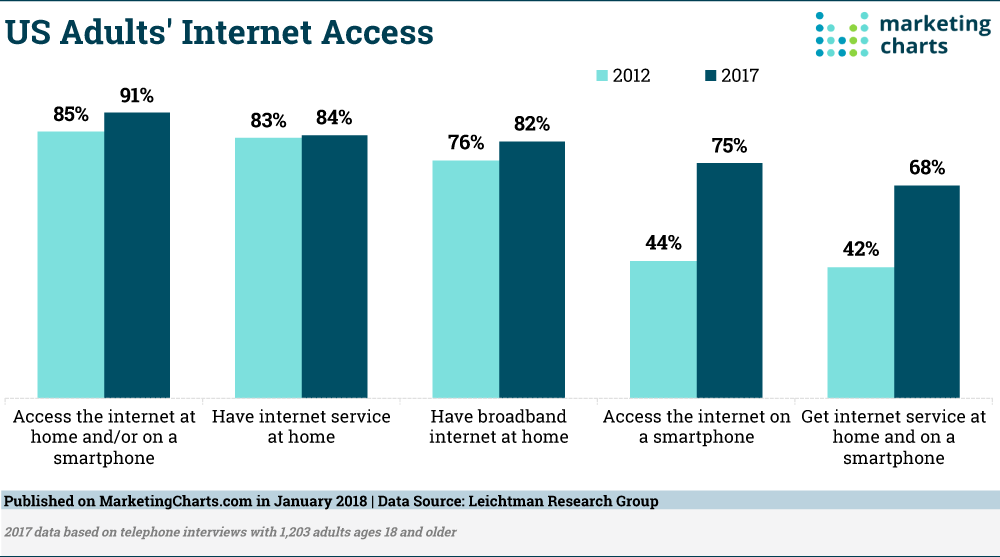
Fully 84% of US households now get some type of internet service at home, up 10% points over the past decade, according to a Leichtman Research Group (LRG) study. While internet service usage is only up a point over the past 5 years, the type of service used is changing.
Read More