Mobile Behavior
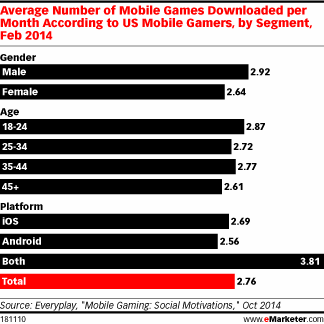
Average Monthly Of Mobile Game Downloads, February 2014 [CHART]
The 18-to-24 age group downloaded the most games on a monthly basis, with an average of 2.87.
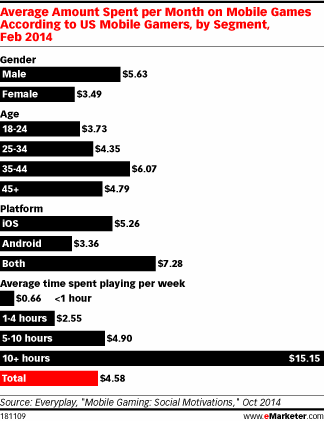
Read MoreAverage Monthly Spending On Mobile Games By Segment, February 2014 [CHART]
The smartphone gaming audience will see faster growth in 2014 and all the way through 2018.
Read MoreGlobal Mobile Gaming Revenues By Device, 2013-2017 [CHART]
Mobile game revenues will rise 42% year over year to hit $25.0 billion in 2014. Next year, the total will come in at $30.3 billion.
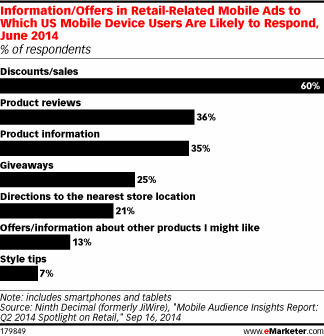
Read MoreOffers In Retail Mobile Ads To Which Users Are Likely To Respond, June 2014 [CHART]
Mobile users were most likely to engage with mobile retail ads before they shopped, cited by 73% of respondents.
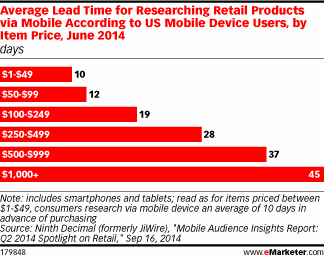
Read MoreAverage Lead Time For Researching Retail Products via Mobile, June 2014 [CHART]
81% of US mobile users turned to their devices to research retail items at home or work—meaning before heading to a brick-and-mortar—while 19% engaged with mobile during a shopping trip.
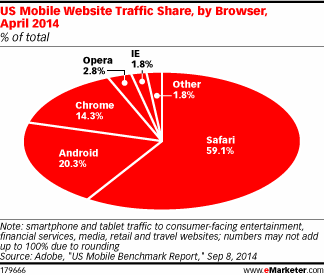
Read MoreMobile Website Traffic Share By Browser, April 2014 [CHART]
Apple devices excluding tablets accounted for 51.6% of mobile internet traffic in Q2 2014.
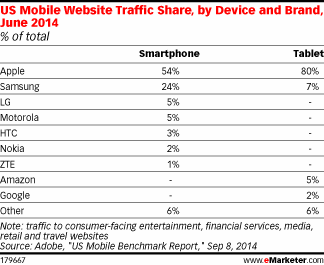
Read MoreMobile Website Traffic Share By Device & Brand, June 2014 [TABLE]
The majority of US mobile website traffic on smartphones in June 2014 came from Apple devices, with a 54% share.
Read MoreAmericans Who Like Geographically-Relevant Mobile Ads, 2012 & 2014 [CHART]
The majority (51%) of US mobile device users agreed that they liked mobile ads with geographically relevant info.
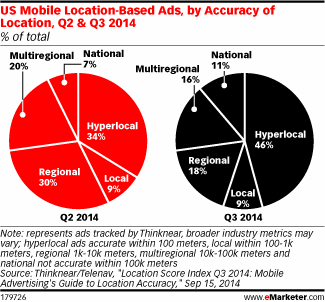
Read MoreMobile Geo-Based Ads By Accuracy Of Location, Q2 & Q3 2014 [CHART]
Hyperlocal campaigns grabbed the largest share of accurate ad impressions served in the US in Q3 2014, at 46%.
Read MoreMobile Tech Omnichannel Retailers Use For In-Store Experiences, Q1 2014 [CHART]
The push for omnichannel retailing is driving personalization in the real world.
Read More