Mobile Behavior
Luxury Shoppers mCommerce Activities, 2011 & 2012 [CHART]
Mobile shopping activity among affluent luxury shoppers in the US saw substantial increases in 2012; the percentage of respondents shopping or purchasing via mobile increased from 22% to 38%.
Read MoreWhere People Mobile Shop, October 2012 [CHART]
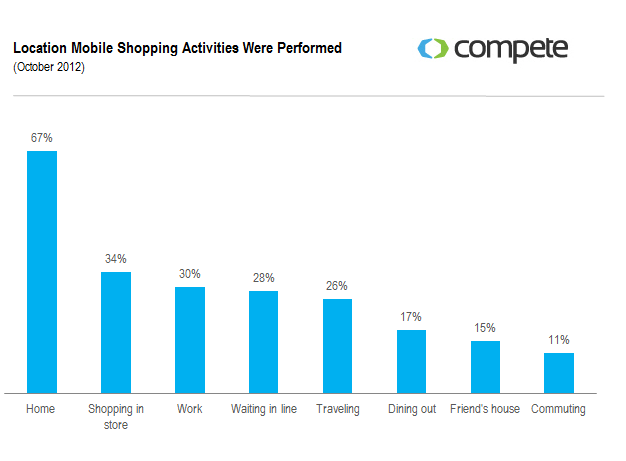
Nearly 1 in 5 consumers performs shopping activities on their phone while dining out.
Read MoreConsumer Electronics Devices Owned & Used Regularly, November 2012 [CHART]
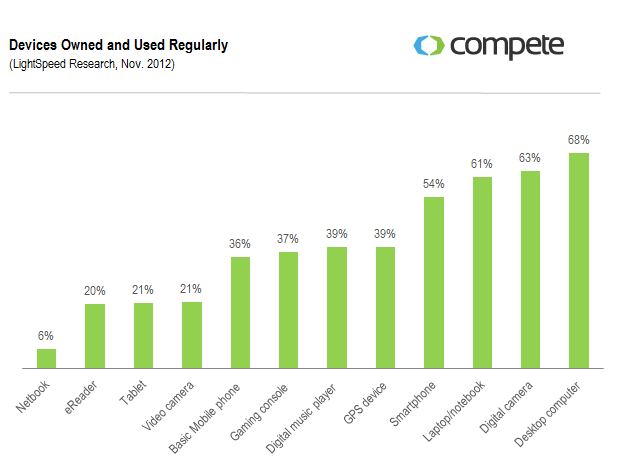
54% of consumers report having access to a smartphone with Internet access – approaching the number of consumers with a laptop and/or desktop computer.
Read MoreConsumer Behavior & Mobile Marketing [INFOGRAPHIC]
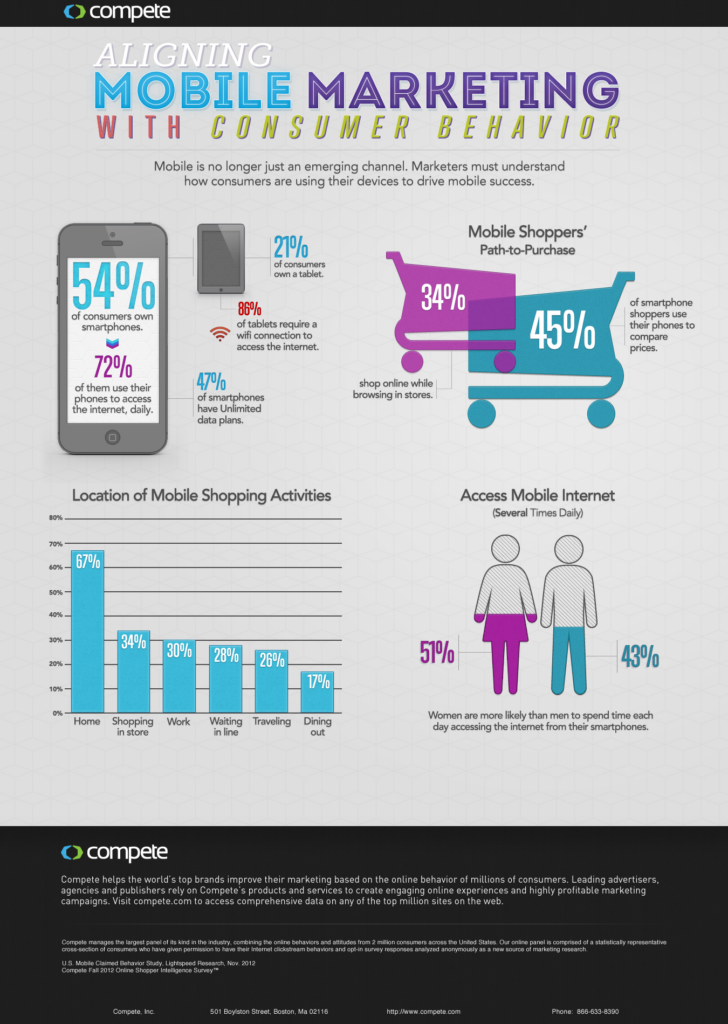
This infographic from LightSpeed Research suggests that mobile should no longer be thought of as an emerging channel for consumers.
Read MoreHow People Watch Video On Smart Phones By Country, 2012 [TABLE]
In 2012, US mobile video viewers watched via both apps and the mobile web: 72% said they’d watched video by either method.
Read MoreTypes Of Streamed Mobile Video By Device, January 2013 [CHART]
The top three kinds of content for both smart phone & tablet users were movies, user-generated content (such as YouTube videos) and TV shows.
Read MorePost-Mobile Search Activity Timing, March 2013 [CHART]
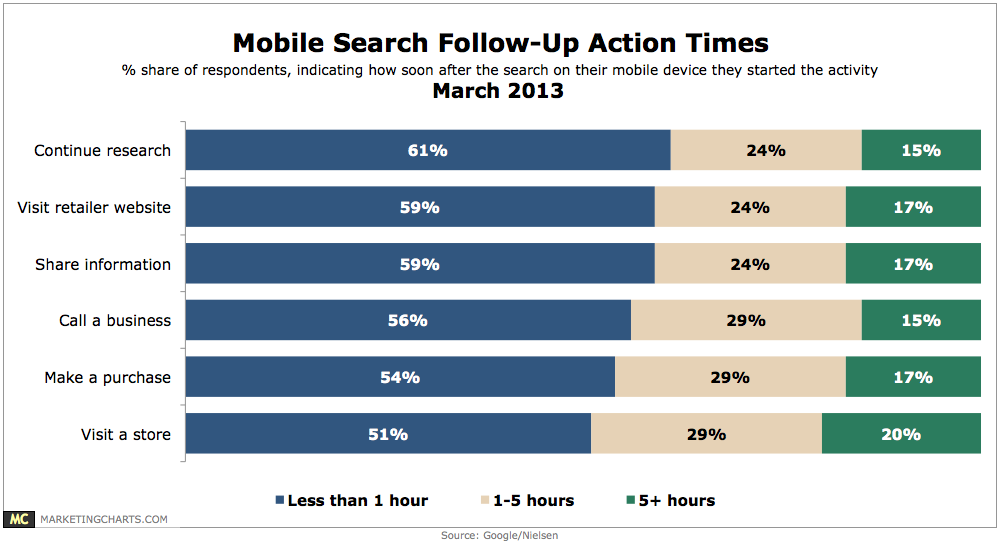
73% of mobile searches trigger additional action and conversions.
Read MoreMostly Mobile Online Teens, March 2013 [CHART]
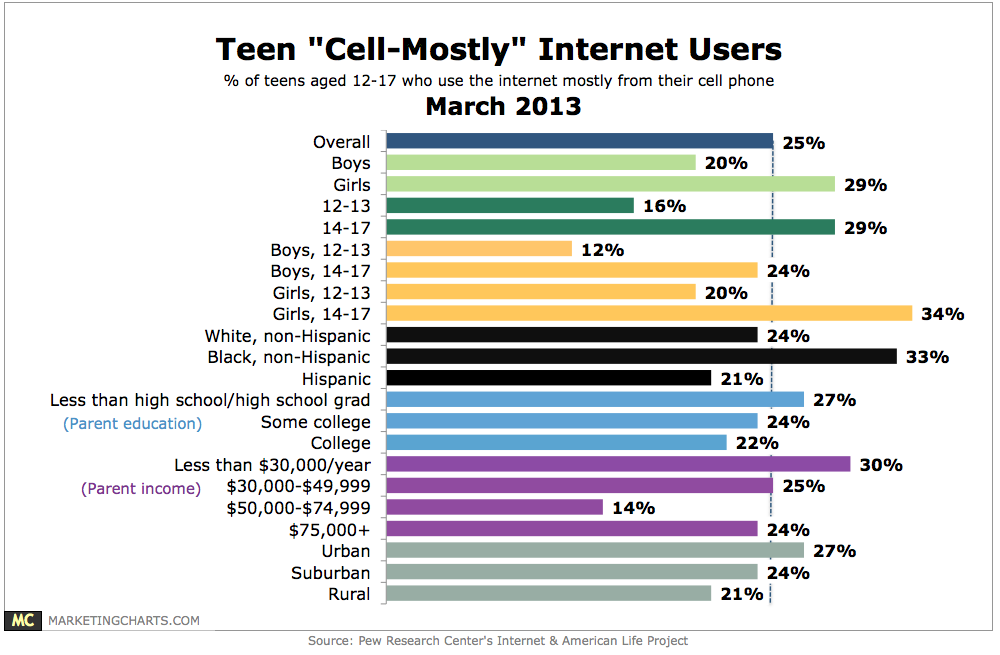
78% of American teens (aged 12-17) now own a cell phone, and 47% of those teens own a smart phone.
Read MoreUS Proximity Mobile Payment Transaction Value, 2011-2016 [CHART]
eMarketer projects that proximity mobile payments in the US are set to explode, growing from $2.12 billion in 2013 to $62.24 billion in 2016.
Read MoreMobile Wallet Services Used For In-Store Purchases, Q1 2012 & Q4 2012 [CHART]
About one-third of mobile Wi-Fi users had used PayPal during the 30 days preceding the poll, compared with 20% for Amazon and 10% for Google.
Read More