Media Consumption
Americans' Leading Sources Of News By Media, June 2013 [TABLE]
FOX led the news channels, cited by 8% of respondents, followed by CNN at 7%.
Read MorePreferred Source Of News By Media & Demographic, June 2013 [TABLE]
Those older than 65 and those without a college degree were the most likely to prefer TV news.
Read MorePreferred Media Type For Main News Source By Age, July 2013 [CHART]
Asked their main source of news about current events in the US and around the world, 55% of survey respondents chose TV, with the internet coming in a distant second at 18%.
Read MoreWeekly Media Consumption Of US Boomers & Silent Generation, March 2013 [CHART]
Boomers spent more time on the web than with any other media channel, including TV.
Read MoreAmericans' Daily Time Spent With Online Media, 2010-2012 [TABLE]
Last year, social networks occupied 37 minutes of the average US consumer’s time per day, up considerably from 30 minutes per day in 2011.
Read MoreGlobal Online Video Completion Rates By Device, Q1 2013 [TABLE]
Tablets showed a higher video completion rate than either PCs or other mobile devices.
Read MoreTime Spent Watching Video On Demand vs. Live Video By Device, Q1 2013 [TABLE]
Digital video viewers were spending substantially longer periods of time watching live video than they were VOD content.
Read MoreMillennials' TV Consumption By Gender, June 2013 [CHART]
Some Millennials are accessing TV content solely via broadband, and the majority of those don’t have any plans to return to pay-TV.
Read MoreDaily Time Spent With Devices By US College Students, 2012 & 2013 [CHART]
Nearly seven out of 10 surveyed college students between the ages of 18 and 34 owned a smart phone in 2013, up 14 percentage points from 2012.
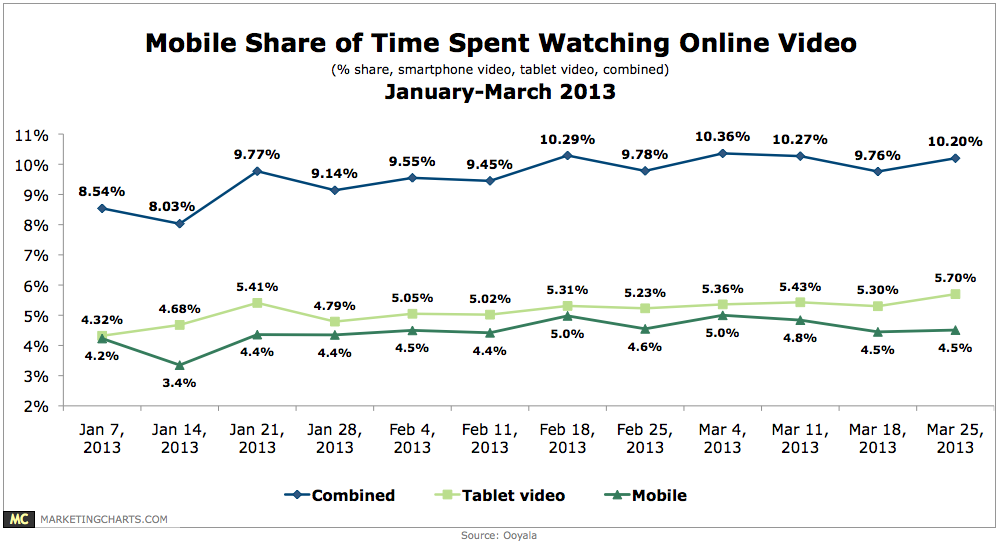
Read MoreTime Spent Watching Mobile Video, January – March 2013 [CHART]
It’s true that mobile video remains only a small fraction of total TV consumption, but smart phones and tablets are eating up a larger share of online video viewing.
Read More