Media Consumption
Device Executives Most Use To Consumer News [CHART]
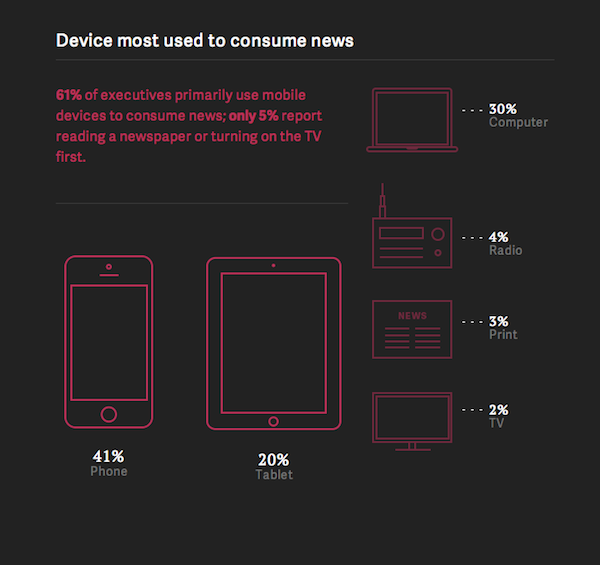
More than 50 percent of the survey responses by executives were completed on a mobile device.
Read MoreTop Sources For Industry News Among Executives [VIDEO]
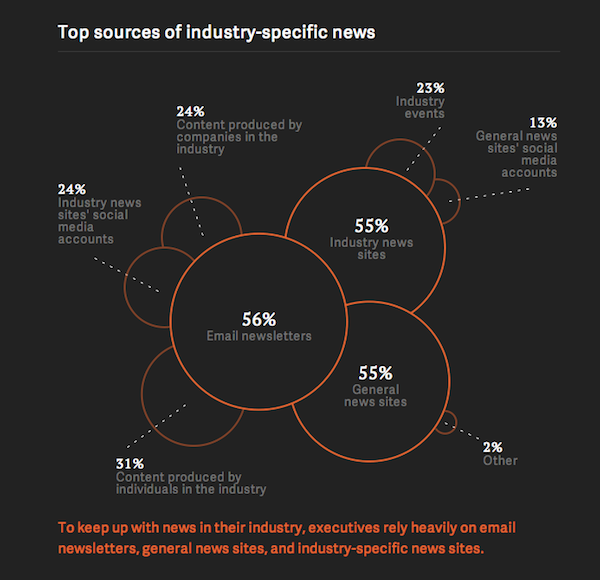
Sixty percent of executives said that an email newsletter is one of the first three sources they turn to in the mornings for news.
Read MoreShare Of Daily TV Consumption, May 2014 [CHART]
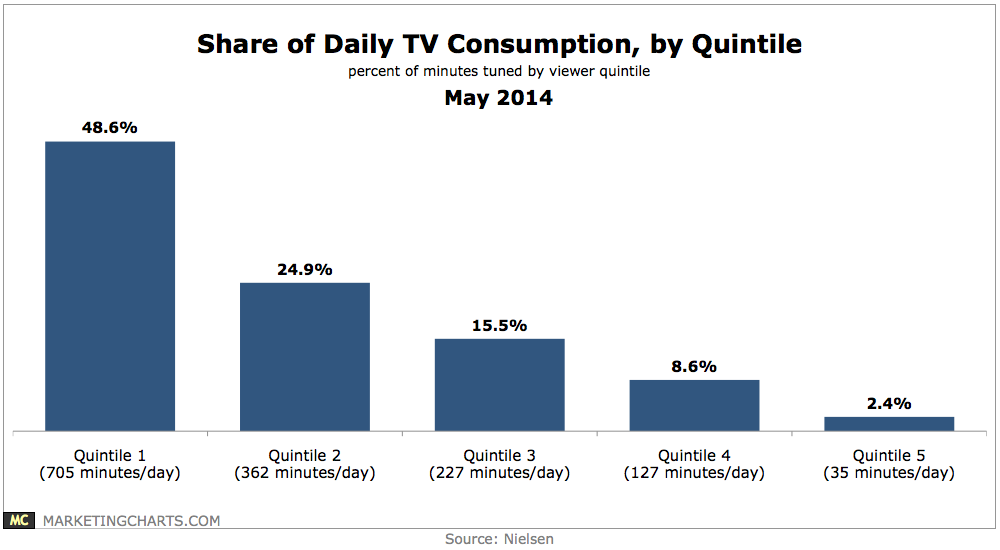
The top quintile of TV viewers (in terms of daily consumption of TV) watch an average of 705 minutes daily, or almost 12 hours of TV per day, with that figure up by almost one hour since 2009.
Read MoreTV Ads Loads, 2009-2013 [CHART]
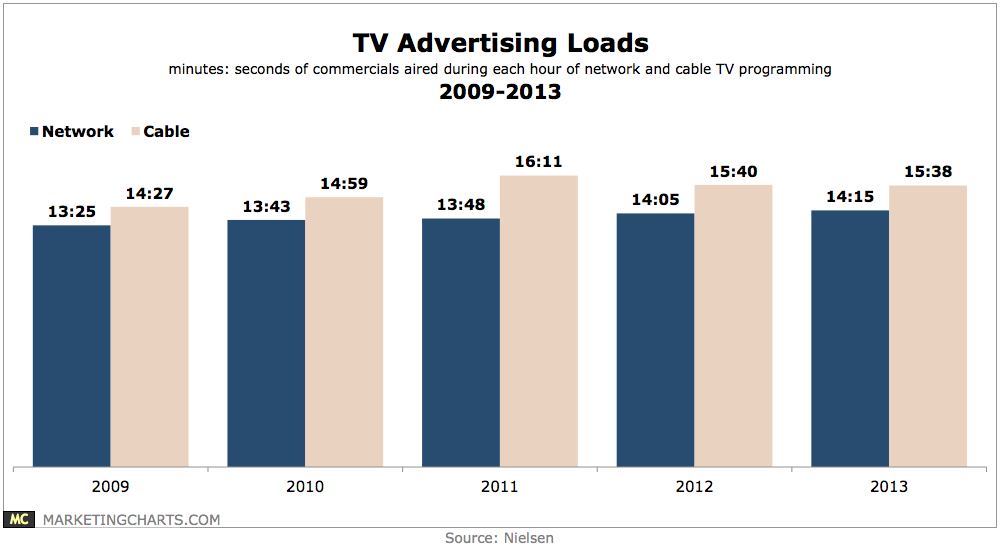
The average American watches somewhere around 5 hours of TV per day and roughly one-quarter of that programming is advertising.
Read MoreHow American Adults Spend Their Time Online, 2010 vs 2013 [CHART]
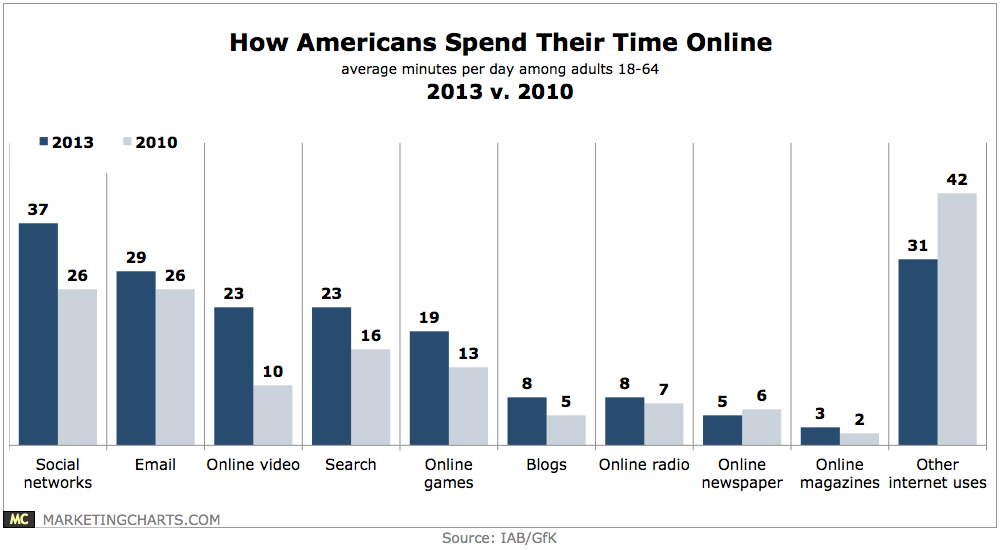
Social networks account for the single largest share of consumers’ time online.
Read MoreShare Of Time Spent Online By Device & Content, January 2014 [VIDEO]
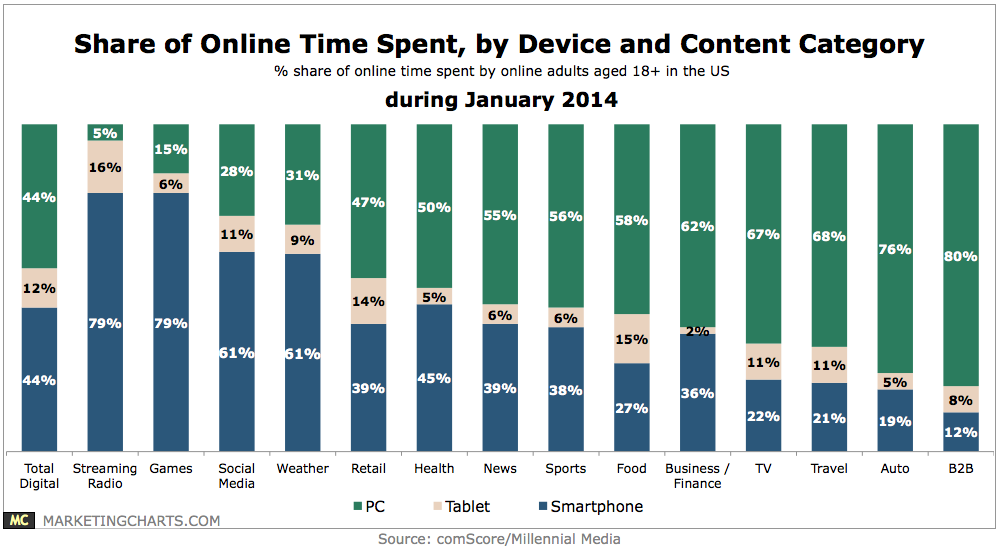
Time spent accessing the internet on smartphones matched online time spent with PCs in January.
Read MoreWeekly Radio Penetration Among Millennials, May 2014 [CHART]
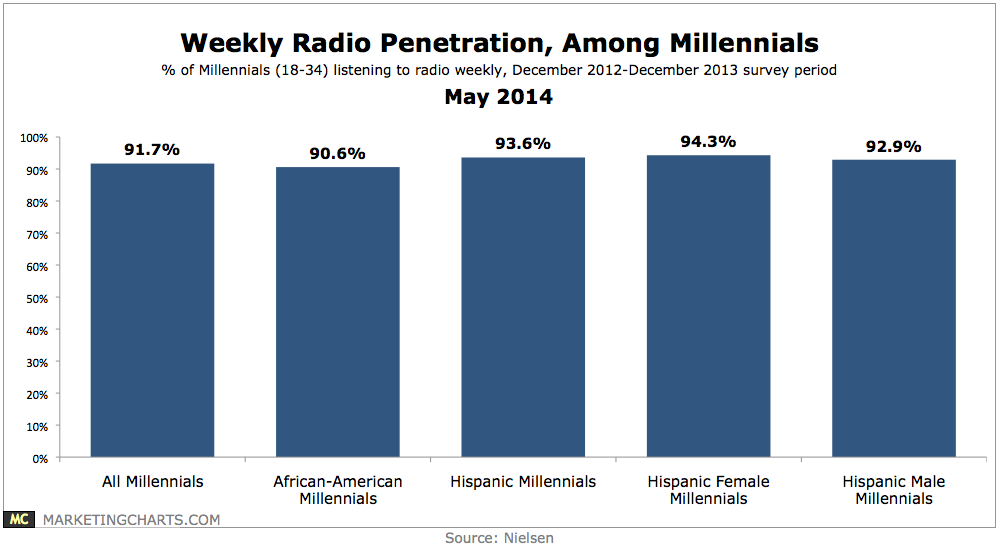
Radio is particularly popular among female Hispanic Millennials (18-34), of whom more than 94% listen to radio on a weekly basis.
Read MoreChange In Interactions With LGBT Media By US Black LGBT Internet Users, March 2014 [CHART]
Black lesbian, gay, bisexual and transgender (LGBT) internet users in the US are paying more attention to LGBT digital media.
Read MoreNumber Of TV Channels Average Household Watches, 2008-2013 [CHART]
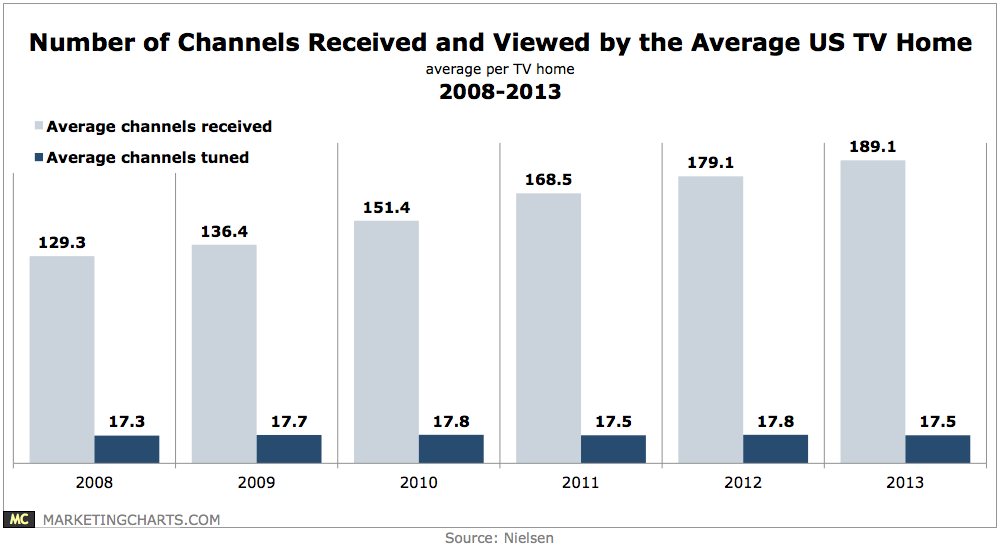
The number of channels watched by the average US TV home has remained between 17 and 18 each year since 2008, despite an ever-growing number of channels received by the average TV home.
Read MoreUK Online Video Viewing Share By Device, Q3 2012-Q3 2013 [TABLE]
Smart phones were accounting for a growing proportion of digital video viewing among the general UK population—up from 17% in Q3 2012 to 23% in Q3 2013.
Read More