Marketing Budgets
Local Media Ad Spending By Local vs National Advertisers, 2013-2018 [CHART]
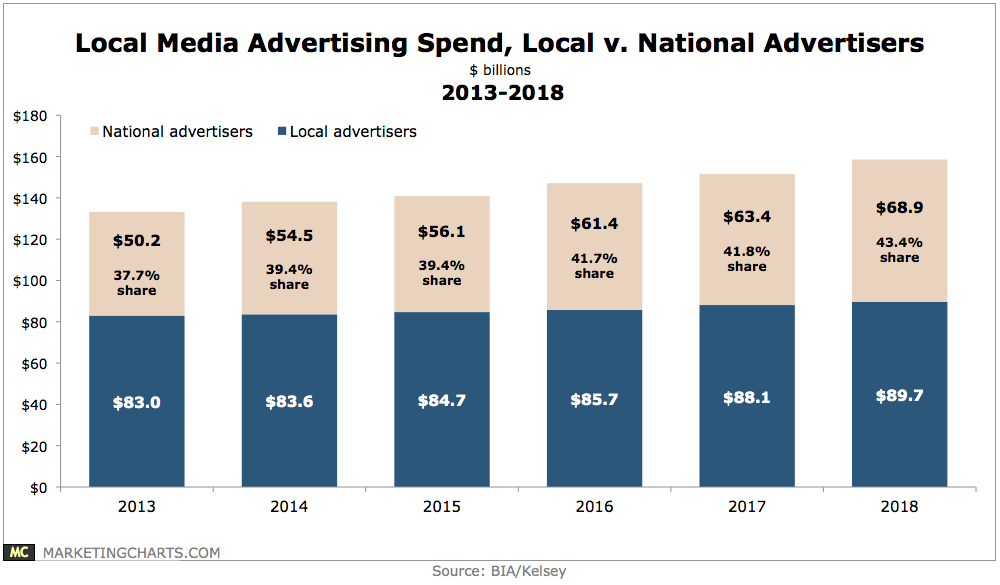
National advertisers are projected to increase their spending on local media advertising by almost 9% this year, to $54.4 billion, representing 39.4% of total local media advertising dollars.
Read MoreGlobal Mobile RTB Ad Spending By Industry, Q1 2014 [CHART]
eMarketer expects increases in US real-time bidding (RTB) digital display ad spending.
Read MoreEmail's Marketing Engagement [INFOGRAPHIC]
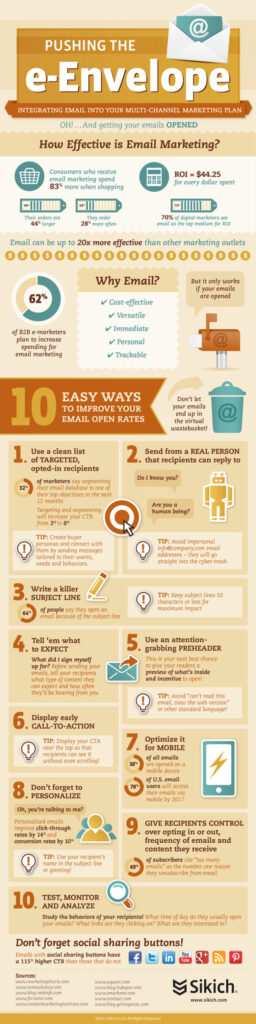
This infographic by Sikich illustrates the effectiveness of email marketing and offers 10 tips to help you break through the clutter.
Read MoreUS Online Video Ad Spending, 2013-2018 [CHART]
Despite the growth of mobile video viewing and the relative stagnation of video viewing on PCs, ad spending still skews heavily toward online video.
Read MoreMarketers' Traditional & Online Spending Mix Projections, April 2014 [CHART]
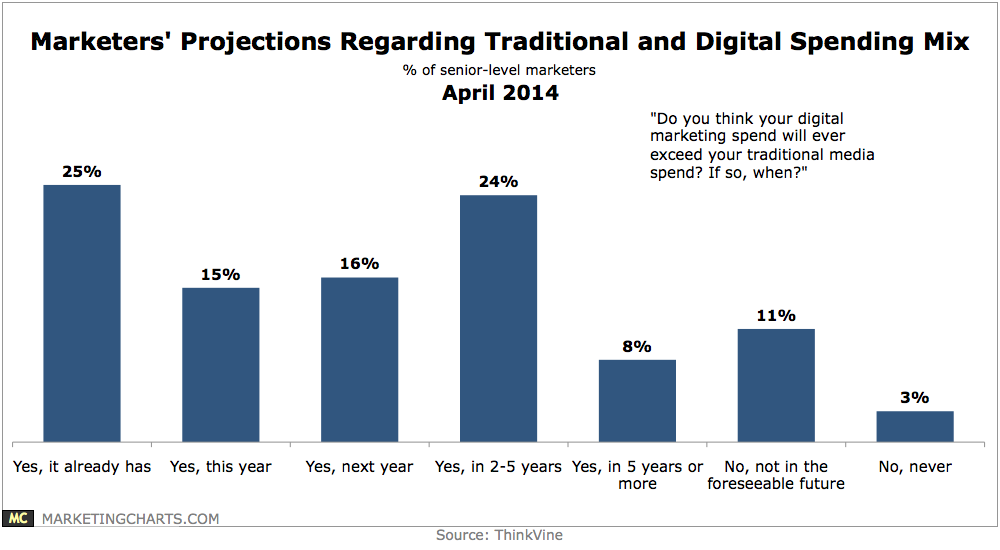
Despite signs that budget shifts from traditional to digital media may be slowing, most marketers believe that their spending on digital marketing will soon exceed their traditional media spending, if it hasn’t already.
Read MoreWestern European Mobile Online Ad Spending Share By Share, 2012-2018 [TABLE]
UK mobile ad spending grew 126.1% in 2013 to account for 19.0% of all digital ad spending in the country; this proportion will increase to 31.9% in 2014.
Read MoreGlobal Marketing Budget Sentiment By Medium, April 2014 [CHART]
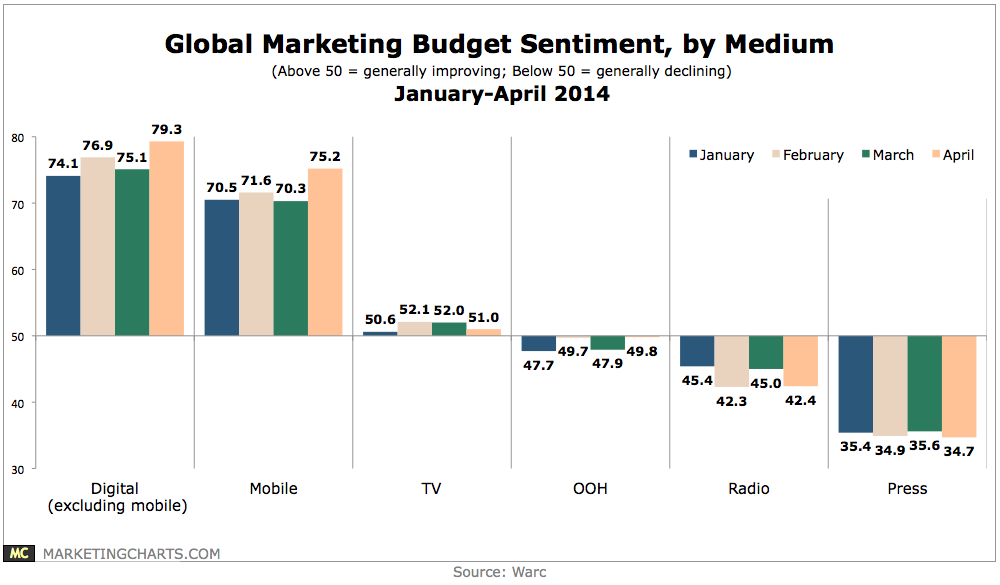
Not surprisingly, digital (excluding mobile) marketing budget expectations have been rapidly increasing throughout the first 4 months of the year, although it’s surprising to see them slightly exceed mobile budget optimism.
Read MoreAd Spending Growth In Western Europe By Country, 2012-2018 [TABLE]
Total media ad spending in Sweden fell last year and amounted to no more than $3.77 billion, down from $3.80 billion in 2012.
Read MoreAd Spending In Sweden By Media, 2013 [TABLE]
Ad spending on daily newspapers dropped 13.4%, and magazines saw a 14.5% decline.
Read MoreUS Major Media Ad Spending Per Hour Spent With Media, 2010-2014 [TABLE]
Print still commands the most ad dollars—despite the fact that it’s losing in terms of absolute time spent with media at double-digit rates each year since at least 2011.
Read More