International
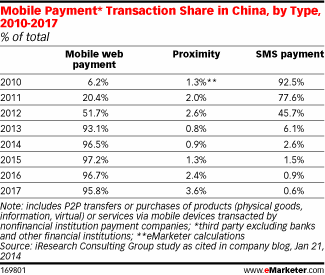
Mobile Payment Transaction Share In China By Type, 2010-2017 [TABLE]
Payments made via text message accounted for just 6.1% of mobile payment transactions in China during 2013, down from 92.5% in 2010.
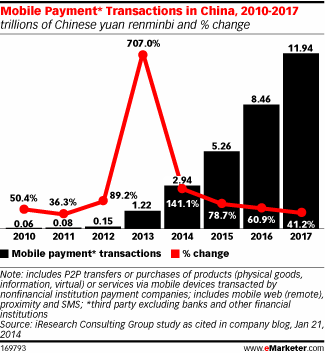
Read MoreMobile Payment Transactions In China, 2010-2017 [CHART]
Third-party mobile payment services in China achieved a total transaction volume of RMB1.22 trillion ($197.09 billion) in 2013, a 707.0% year-over-year increase.
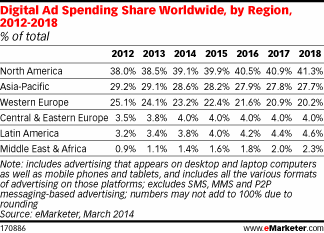
Read MoreGlobal Online Ad Spending Share, 2012-2018 [TABLE]
The US is still the single biggest spender on digital ads, with North America thus the highest-spending region.
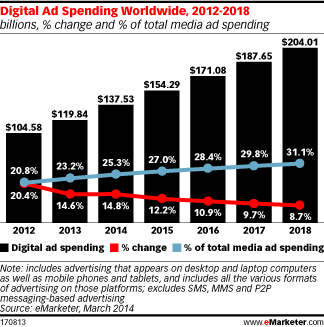
Read MoreGlobal Online Ad Spending, 2012-2018 [CHART]
Spending on ads served to internet-connected devices including desktop and laptop computers, mobile phones and tablets will reach $137.53 billion this year.
Read MoreOnline Ad Spending In Spain, 2011-2017 [CHART]
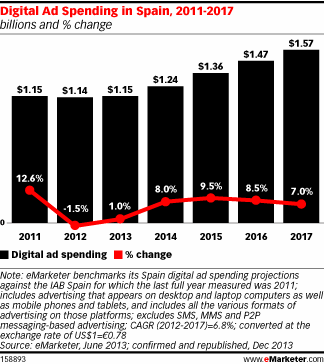
The estimates for 2013 digital ad spending from IAB Spain align closely with eMarketer’s calculation of $1.15 billion.
Read MoreOnline Ad Spending Share In Spain By Format, 2013 [CHART]
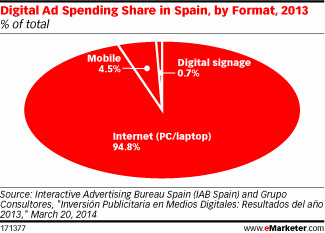
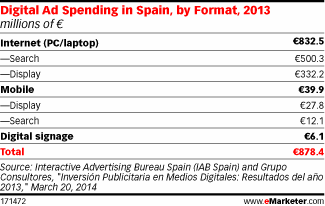
Spending on mobile ads amounted to just 4.5% of all digital expenditure in 2013, or €39.9 million ($53.2 million).
Read MoreOnline Ad Spending In Spain By Format, 2013 [TABLE]
IAB Spain predicted that digital ad spending would rise between a modest 1% and 3% this year as interactive ads continue to prove their value to hard-pressed marketers.
Read MoreUK Online Shoppers & Buyers, 2011-2017 [CHART]
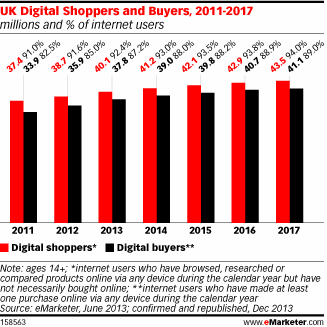
57% of UK digital buyers had used a click-and-collect service.
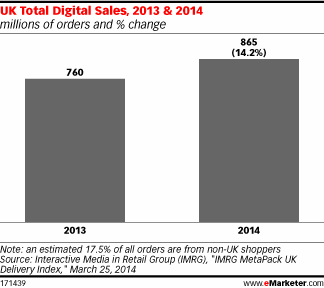
Read MoreUK Total Online Sales, 2013 & 2014 [CHART]
In 2013, 760 million digital orders were dispatched, and that figure is set to rise 14.2% in 2014 to 865 million.
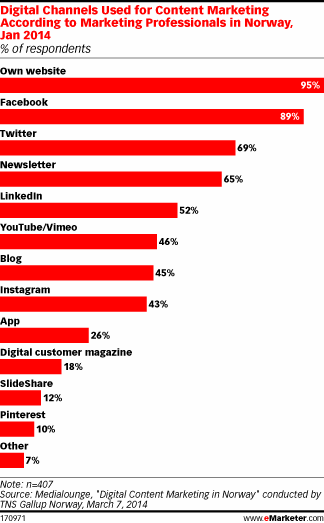
Read MoreChannels Norwegians Use For Content Marketing, January 2014 [CHART]
Nearly six in 10 respondents said digital content was an important part of their marketing mix.
Read More