eCommerce
Conversion Rate Optimization [INFOGRAPHIC]
This infographic from DPFOC illustrates the critical aspects of conversion rate optimization.
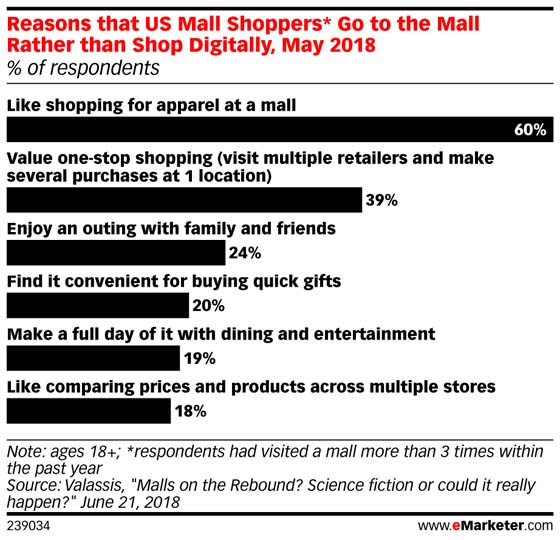
Read MoreWhy People Go To The Mall [CHART]
It’s true, merchants can no longer rely on traditional anchors—usually department stores—to attract crowds. According to Coresight Research, the number of full-line department stores will shrink to 4,750 by 2023, down 19.5% from 2017.
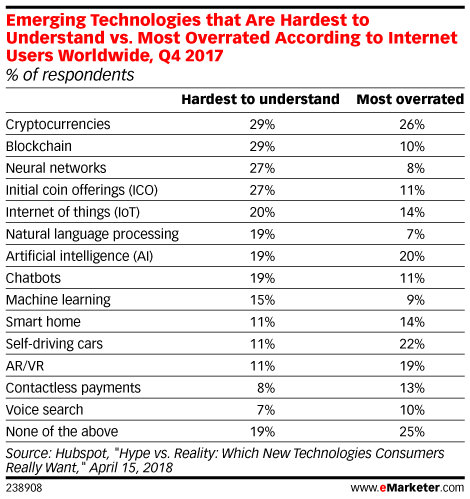
Read MoreAttitudes Toward Emerging Technologies [TABLE]
A global survey found that among a variety of emerging concepts, cryptocurrencies and their underlying technology, blockchain, leave the most people scratching their heads.
Read MoreCryptocurrency Market Penetration [CHART]
Nearly seven in 10 respondents who owned cryptocurrency said they plan to increase their investment in the next 12 months. And among those who didn’t own any, 21% planned to purchase cryptocurrencies in that same timeframe.
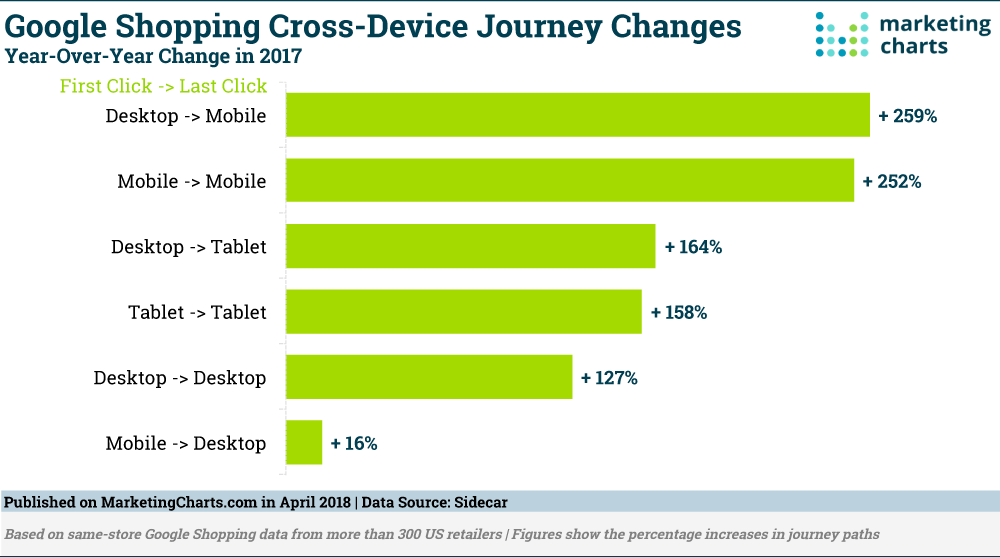
Read MoreCross-Device Shopping Journey Changes [CHART]
US retailers are prioritizing Google Shopping ads over text ads, according to the 2018 Google Shopping Benchmarks Report from Sidecar. Based on an analysis of more than 300 US retailers’ activity in 2017, the report notes that ad spending across Google’s search network grew by 20%, with much greater increases for Google Shopping ads (34%) than for text ads (2%).
Read MoreVoice Commerce Users By Age & Platform [TABLE]
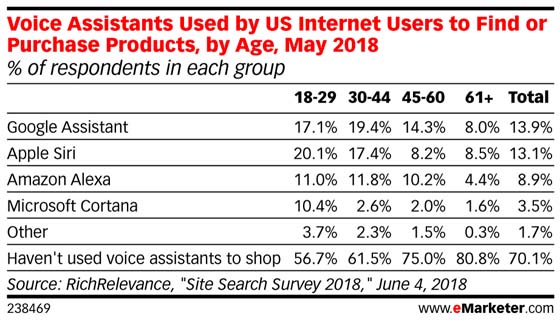
30% of US internet users have used a voice assistant to look for product information or purchase products—in other words, shop or buy. Google Assistant (13.9%) and Siri (13.1%) had the highest usage for these activities.
Read MoreUS Proximity Payment Users By Platform [CHART]
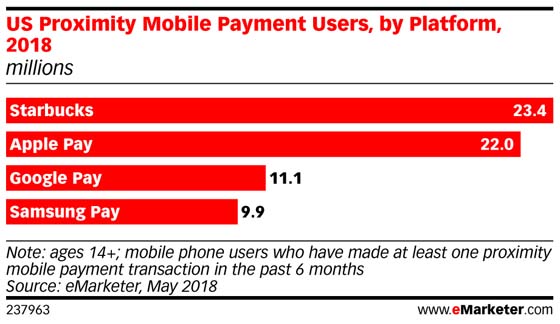
Starbucks will remain the most popular proximity mobile payment app, staying ahead of Apple Pay and other competitors. This year, 23.4 million people ages 14 and over will use the Starbucks app to make a point-of-sale purchase at least once every six months.
Read MoreTime Spent With eTailers [CHART]
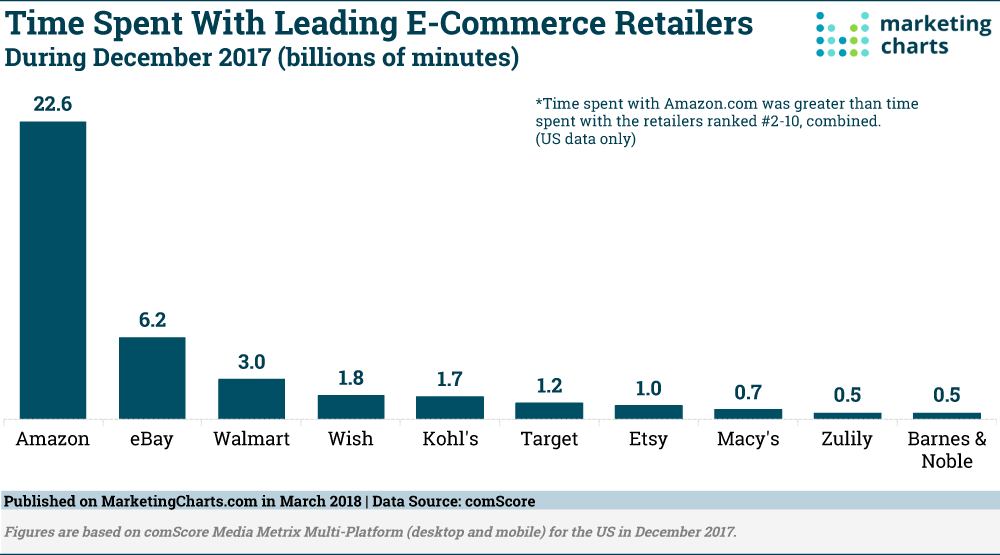
Americans spent 22.6 billion minutes on Amazon during December 2017, more than the combined total spent on the rest of the top 10 e-commerce retailers (16.6 billion).
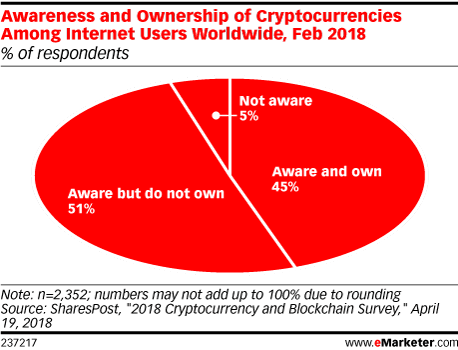
Read MoreCryptocurrency Awareness [CHART]
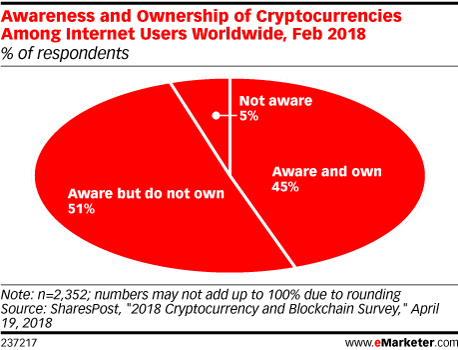
Nearly seven in 10 respondents who owned cryptocurrency said they plan to increase their investment in the next 12 months.
Read MoreeCommerce KPIs [INFOGRAPHIC]
This infographic from Marketizator illustrates twelve essential eCommerce KPIs to track.
Read More
