eCommerce
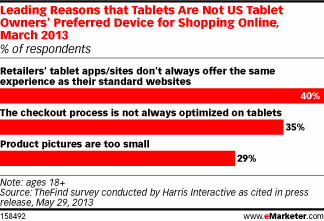
Top Reasons Tablets Are Not A Preferred Online Shopping Device, March 2013 [CHART]
The tablet checkout process has also been a hindrance to greater eCommerce conversion.
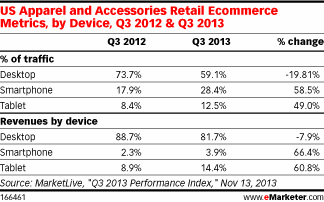
Read MoreUS Apparel & Accessories eCommerce Metrics By Device, Q3 2012 & Q3 2013 [TABLE]
In 2012, tablets for the first time were responsible for a majority of US retail mCommerce sales, and that share will expand further in the coming years.
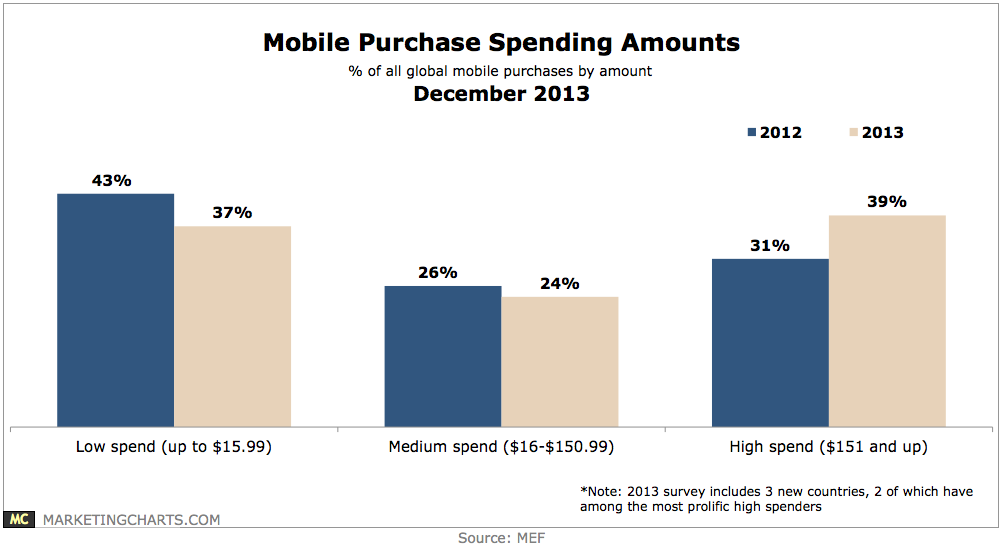
Read MoremCommerce Spending Amounts, December 2013 [CHART]
65% of mobile media users across 13 developing and developed markets have used their device to purchase goods or services.
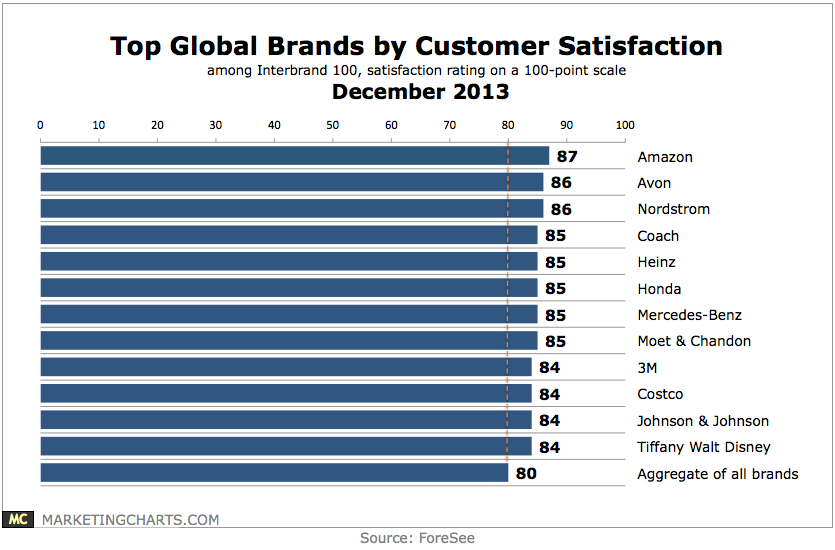
Read MoreTop Global Brands By Customer Satisfaction, December 2013 [CHART]
The average customer satisfaction with the top brands is 80 on a 100-point scale, with 68 of the brands scoring an 80 or above, considered by ForeSee to be the threshold of excellence.
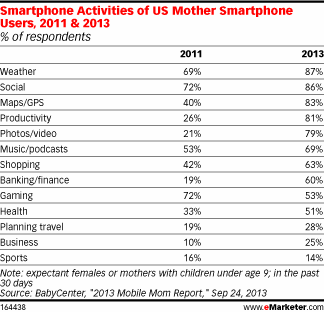
Read MoreUS Mothers' Smart Phone Activities, 2011 & 2013 [TABLE]
Escapism (39%), social (23%), and shopping (12%) were the most popular functions among mothers glued to their mobiles.
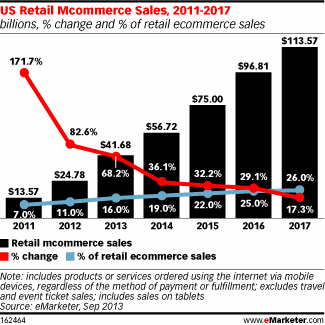
Read MoreUS Retail mCommerce Sales, 2011-2017 [CHART]
By 2017, mobile will account for 26.0% of US retail eCommerce sales (which exclude travel and event tickets), up from 19.0% in 2014.
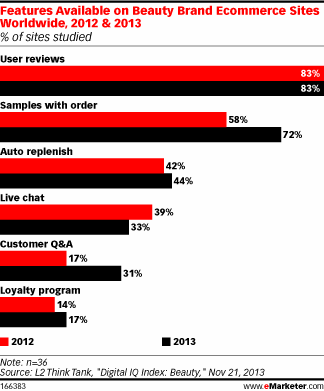
Read MoreTop Features Of Beauty Brand eCommerce Sites, 2012 & 2013 [CHART]
83% of sites had incorporated user reviews, making it the most widely adopted feature.
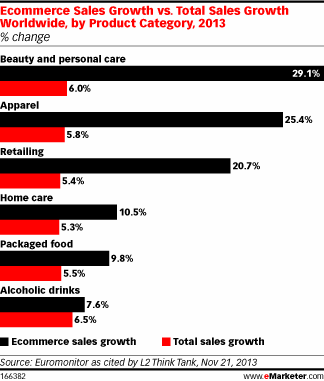
Read MoreeCommerce Growth By Product Category, 2013 [CHART]
eCommerce sales were expected to grow by almost 30% in 2013, compared with only 6% for total sales.
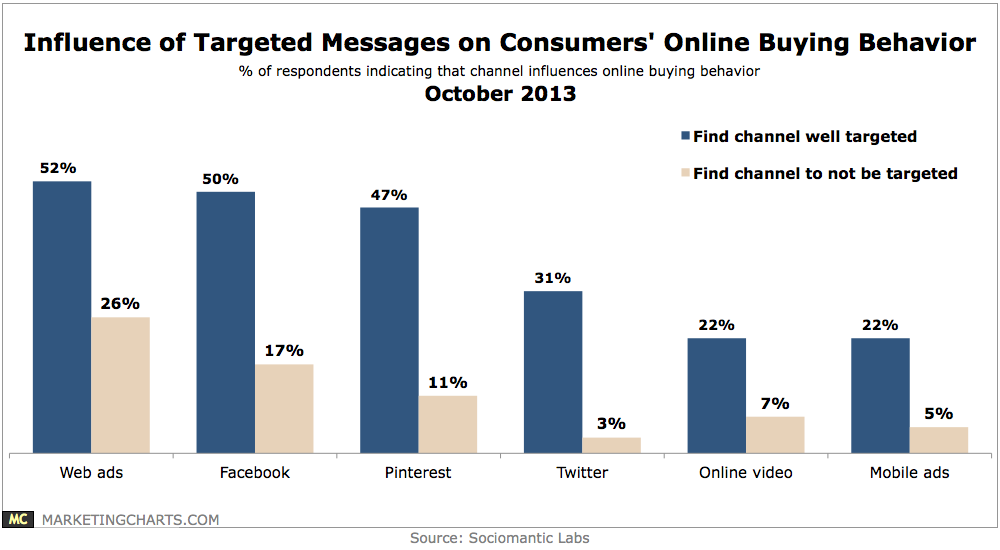
Read MoreTargeted Ads Influence Over Online Buying, October 2013 [CHART]
Respondents were more likely to indicate that a marketing or advertising channel influenced their buying behavior when they found the messages delivered through that channel to be well targeted to them.
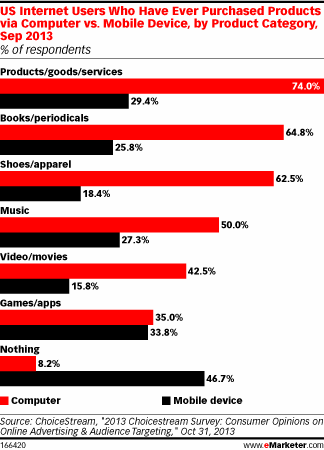
Read MoreAmericans Who Have Purchased Products via Computer vs Mobile by Category, September 2013 [CHART]
Though less common, more than half had Completing a purchase via mobile at some point.
Read More