eCommerce
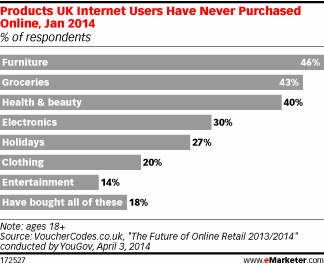
Products United Kingdom Residents Have Never Purchased Online, January 2014 [CHART]
Health and beauty products are among the least popular items for online purchasing.
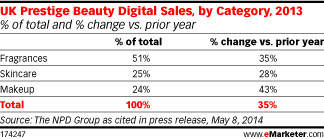
Read MoreUK Prestige Beauty Online Sales By Category, 2013 [TABLE]
Digital sales accounted for just 6.2% of total prestige beauty sales in the UK last year, totaling £102 million ($159.38 million).
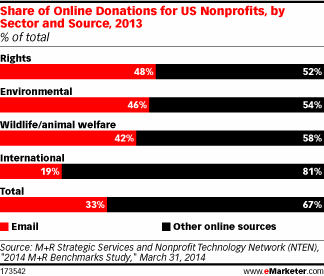
Read MoreShare Of Online Nonprofit Donations By Sector & Source, 2013 [CHART]
Email open rates, clickthrough rates, page completion rates—and as a result, email response rates—were all down for US nonprofits last year.
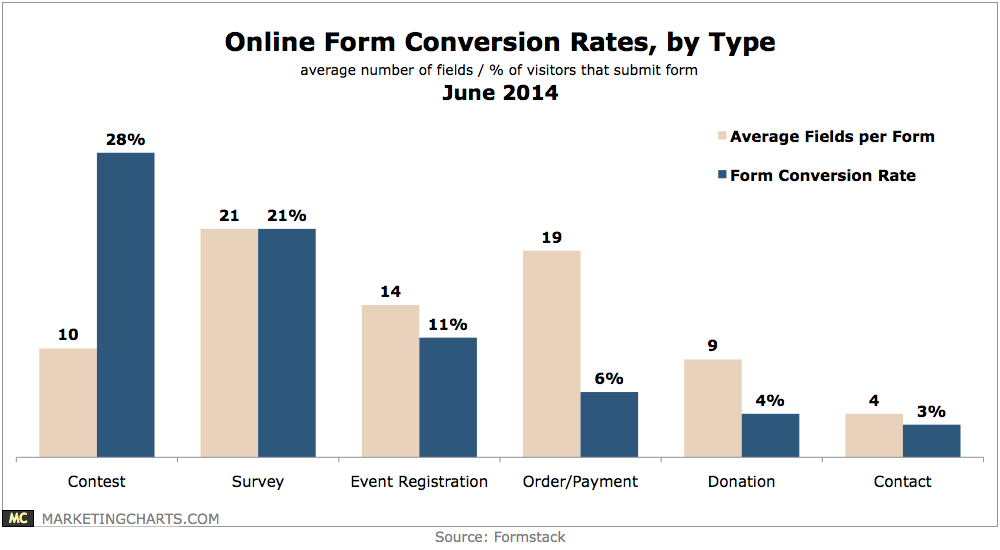
Read MoreForm Conversion Rates By Type, June 2014 [CHART]
The average conversion rate for forms in the US is 7%.
Read MoreAmazon Prime Spending vs Non-Prime Customers [CHART]
People who subscribe to Amazon Prime spend a lot more than non-Prime members.
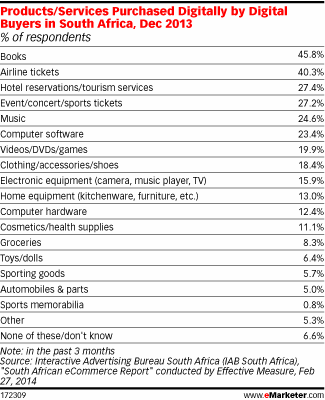
Read MoreProducts & Services South Africans Buy Online, December 2013 [TABLE]
Books and items related to travel and entertainment were the top products and services purchased online by digital buyers in South Africa.
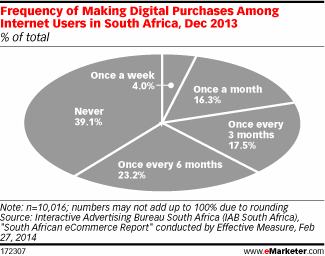
Read MoreFrequency With Which South Africans Make Online Purchases, December 2013 [CHART]
Digital buying wasn’t too frequent of an activity, with just 4.0% and 16.3% of internet users saying they did so once a week or month, respectively.
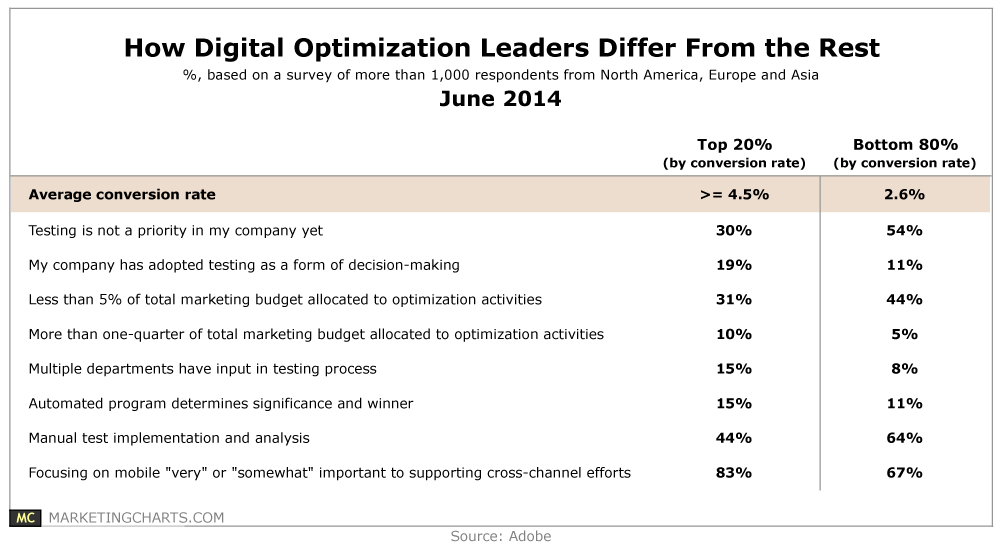
Read MoreOnline Optimization Conversion Rates, June 2014 [TABLE]
Increasing conversion rates is a top digital priority for marketers this year.
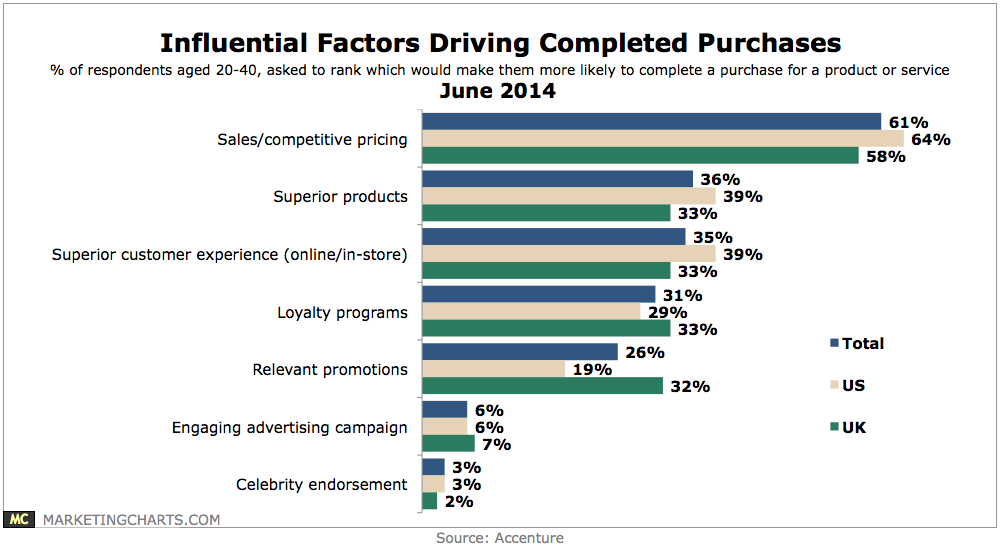
Read MoreInfluences Over Completing Purchases, June 2014 [CHART]
Consumers aged 20-40 in the US and UK were asked to rank the factors that would make them most likely to complete the purchase of a product or service, with sales and competitive pricing (61%) by far their most critical.
Read MoreGoPro Shark Attack & Twitter Relationship Surveys [VIDEO]
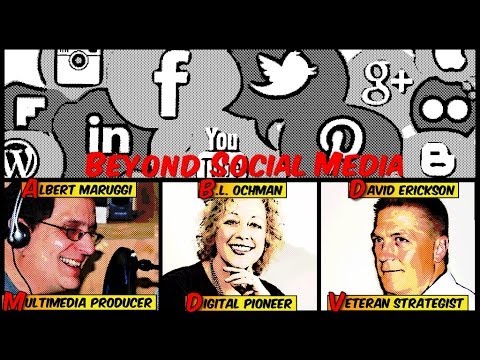
Episode 52 of the Beyond Social Media show: David Erickson & BL Ochman discuss the GoPro Shark Attack video as a marketing gimmick & Twitter’s social graph.
Read More