Digital Advertising
US Ad Spending Changes, Q4 2011 vs Q4 2012 [CHART]
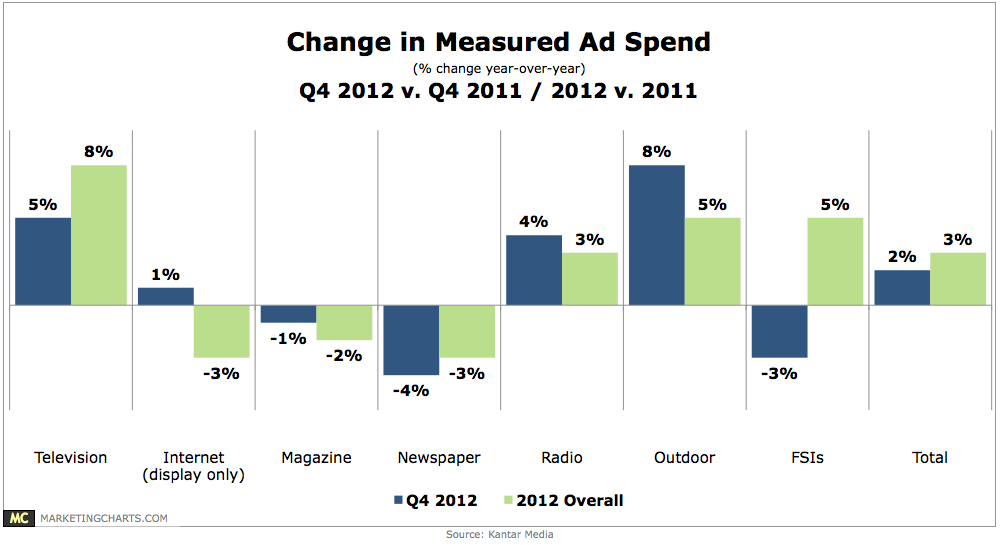
US ad spending increased by 2% year-over-year in Q4 2012, and by 3% for the full year to reach $139.5 billion.
Read MoreAd Spending Outlook, March 2013 [CHART]
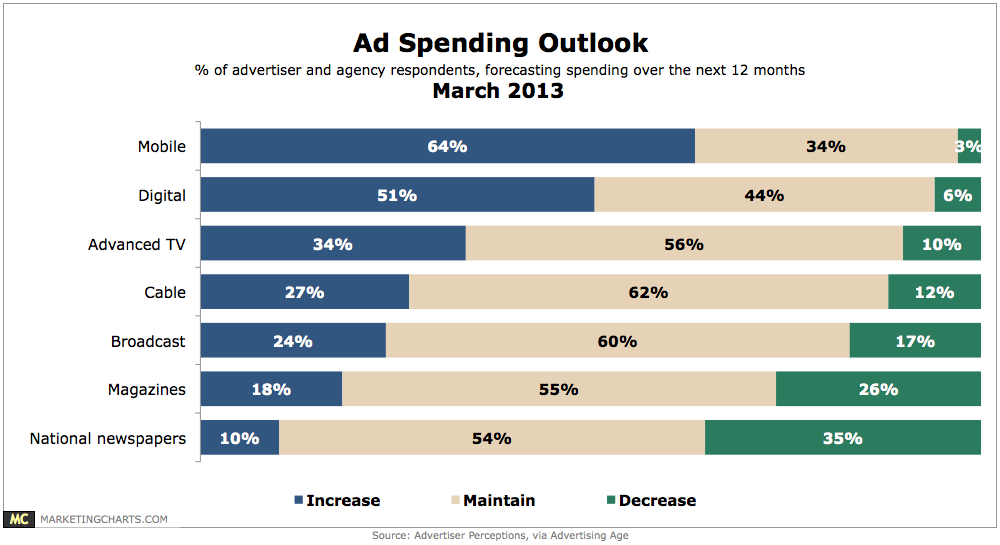
64% of advertisers will increase their mobile ad spending over the next 12 months.
Read MoreAdvertising Brand Lift By Audience Targeting Type, March 2013 [CHART]
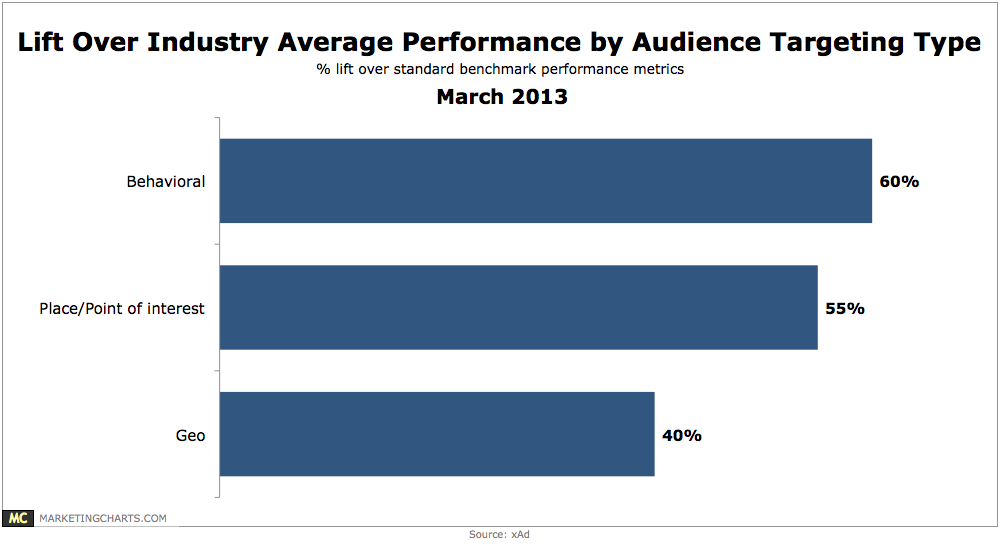
Close to 95% of national advertiser campaigns now use some form of location targeting in mobile.
Read MoreClient Demand For Rich Media Advertising, March 2013 [CHART]
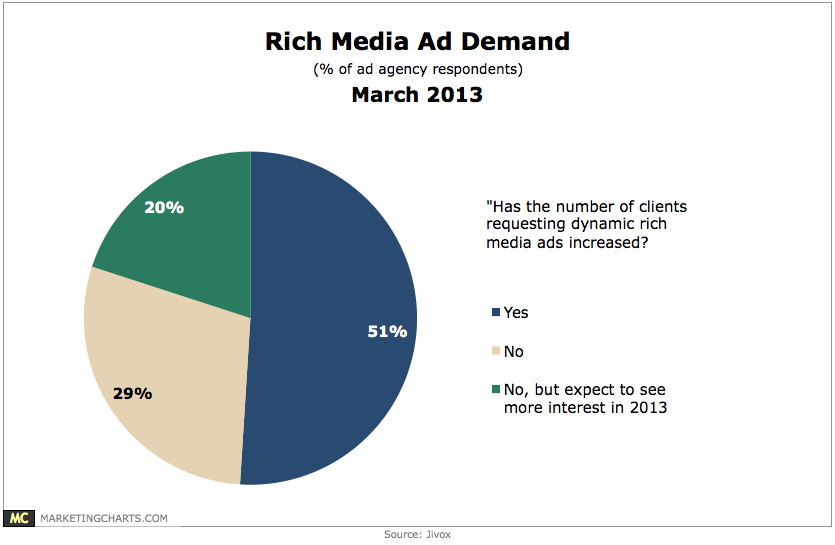
51% of ad agencies report a rise in client demand for dynamic rich media ads, and another 20% expect increased interest this year.
Read MoreDisplay Advertising Landscape [INFOGRAPHIC]
This infographic from LUMA Partners illustrates today’s complex display advertising landscape.
Read More
Agency Perceptions Of Client Online Marketing Talent Gaps, March 2013 [CHART]
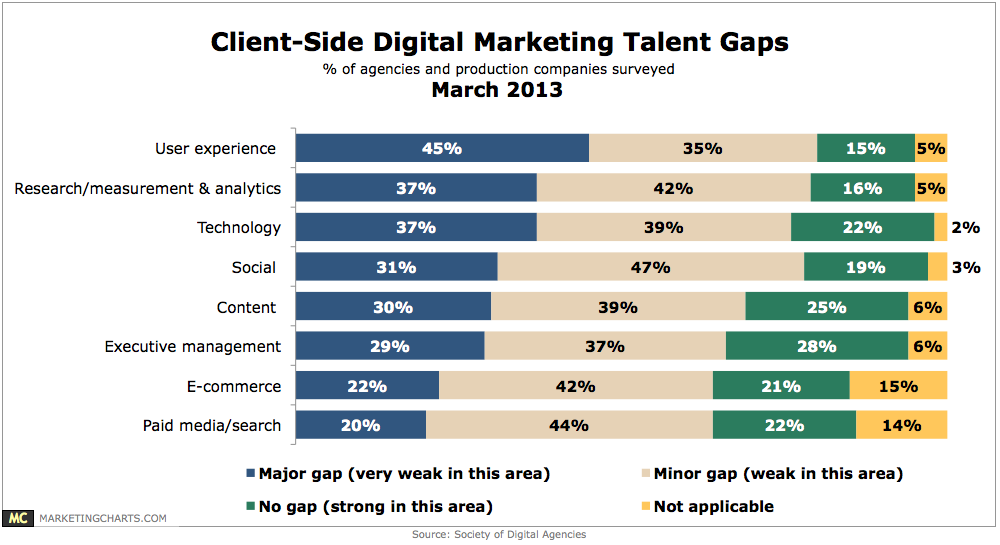
80% of agencies and production companies pointed to user experience (UX) as a major (45%) or minor (35%) talent gap among clients.
Read MoreTop B2B Online Marketing Activities, March 2013 [CHART]

Email (64%) is B2B marketers’ most important digital marketing activity.
Read MoreSources That Influence Vacation Choice For US Cruise vs. Non-Cruise Travelers, April 2011 [TABLE]
While many cruisers turn to travel agents to book, only 11% considered agent recommendations as a purchase influence.
Read MoreAdvertising Click-Through Rate Benchmarks, March 2013 [CHART]
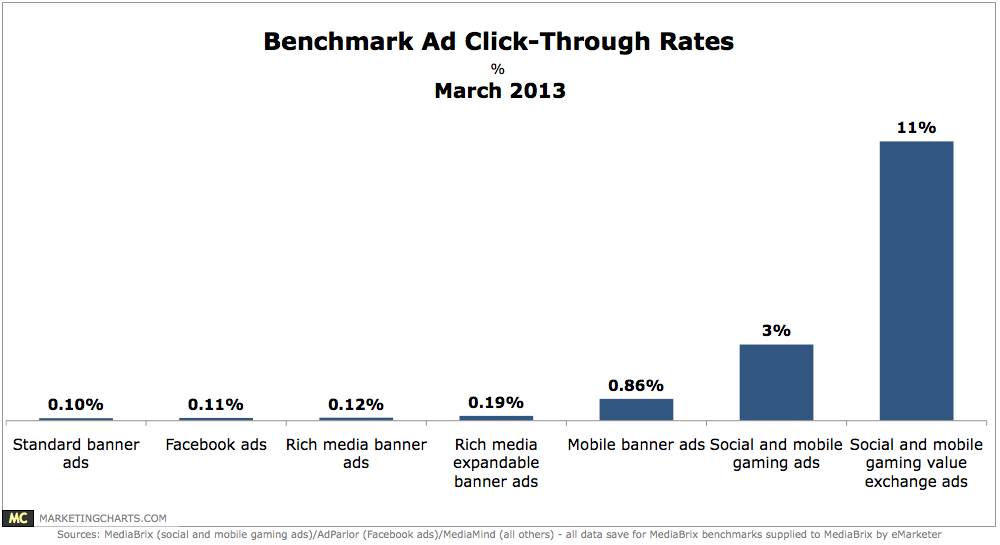
Social and mobile gaming ads generate an average click-through rate (CTR) of 3%.
Read More