Demographics
College Students' Multitainment Activities, February 2013 [CHART]
The most popular activity students engaged in while watching TV was using Facebook or Twitter, at 63% of respondents.
Read MoreDaily Time Spent With Devices By US College Students, 2012 & 2013 [CHART]
Nearly seven out of 10 surveyed college students between the ages of 18 and 34 owned a smart phone in 2013, up 14 percentage points from 2012.
Read MoreUpscale Latinos, June 2013 [TABLE]
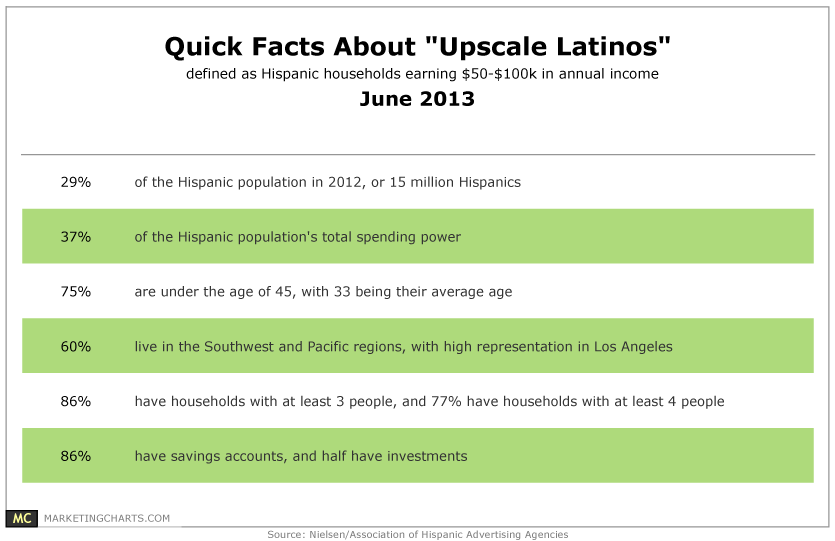
Nielsen has released some data concerning upscale Latinos, which accounted for 29% of the Hispanic population last year but an outsized 37% of its total spending power.
Read MoreDevices College Students Own, June 2013 [CHART]

The average 18-34-year-old college student owns 7 tech devices (6.9 to be precise), up from 6.4 last year.
Read MoreDemographic Profile Of American Tablet Owners, November 2010-May 2013 [TABLE]
Tablet ownership among Hispanics made a big leap, with penetration rates rising from 20% in August 2012 to 34% by May 2013.
Read MoreMobile Media Consumption By Gender, March 2013 [CHART]
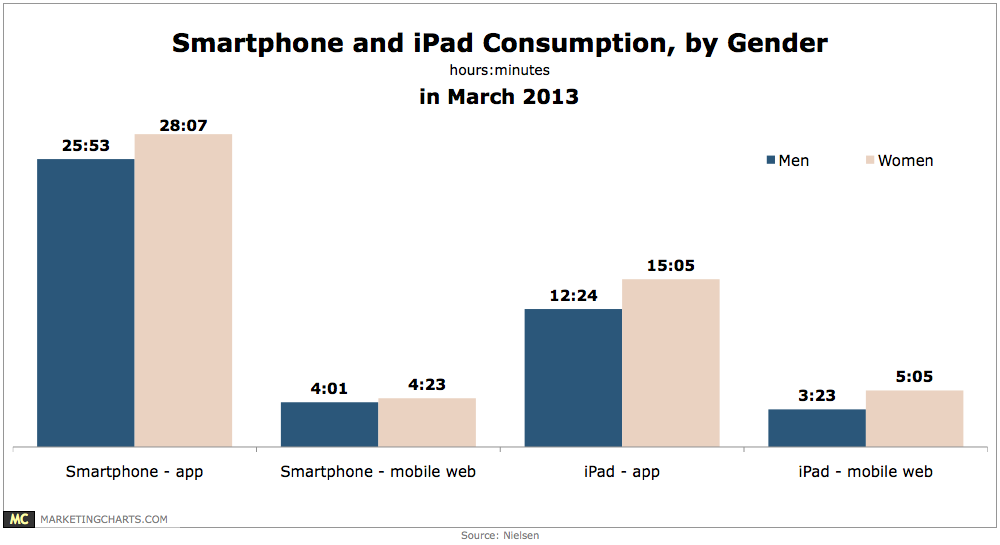
Smart phone users spent just 13% of their time using the mobile web, and iPad users a relatively larger – but still minor – 24%.
Read MoreUS Video Gamers By Demographic, 2013 [CHART]
Women made up 45% of the gaming audience, and 68% of gamers were over the age of 18.
Read MoreAmerican Tablet Adoption Rates By Demographic, May 2013 [CHART]
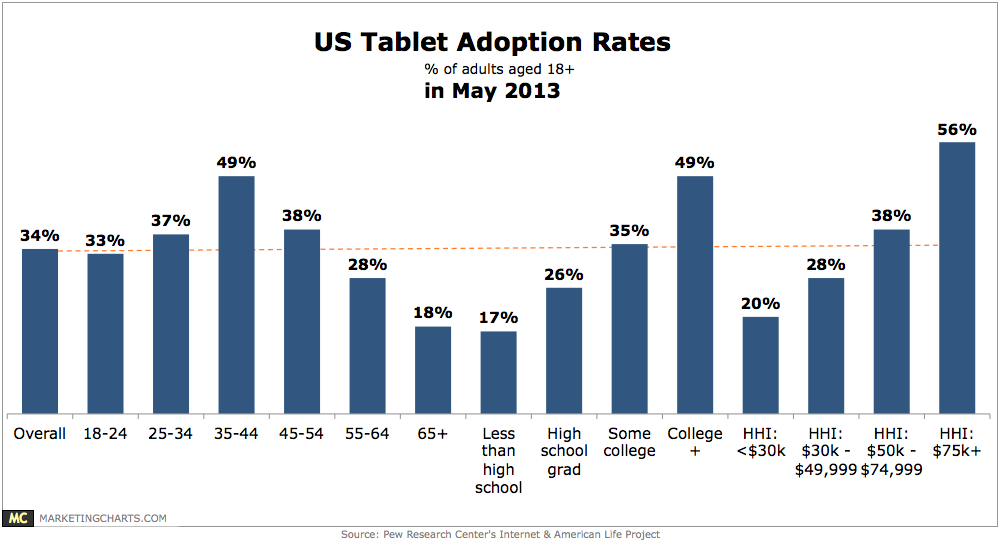
Pew’s Internet & American Life Project found 34% of American adults reporting ownership of a tablet, almost double the 18% adoption rate it found in a survey fielded in April 2012.
Read MoreDemographics Of Social Media Users By Network, October 2012 [TABLE]
Mobile will be the dominant platform to reach US millennials for the foreseeable future.
Read MoreLGBT Mobile Shopping Activities, June 2013 [CHART]
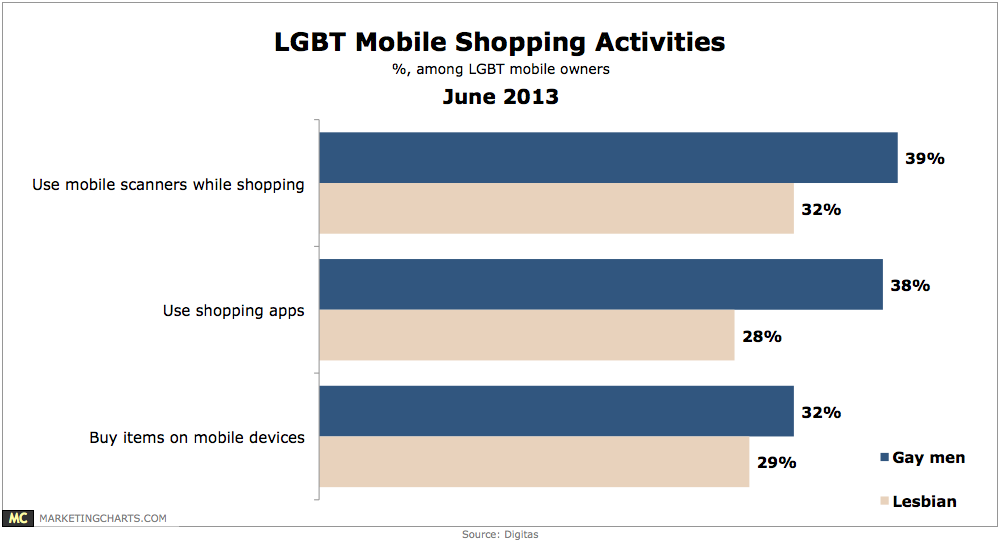
Men are more likely than women to engage in a variety of mobile shopping activities, with gay men more likely to: use mobile scanners while shopping (39% vs. 32%).
Read More