Content Marketing
American Mothers’ Top Sources For Recipes, September 2012 [CHART]
Seventy-eight percent of US mom internet users surveyed who looked for recipes online or off went to websites vs. 66% who said they’d used Pinterest.
Read MoreTop Ways Pinterest Inspires American Women, December 2012 [CHART]
Thirty percent of those surveyed from the entire Allrecipe.com and Meredith pool reported using Pinterest at least once a week.
Read MoreTop Desired Car Technologies, October 2011 [CHART]
Use of smart phone apps for services like Pandora or Spotify for in-car music listening has shown rapid growth, rising from 6% of US mobile phone owners in 2010 to 17% in 2012.
Read MoreB2B Marketing Channels By Lead Quality, November 2012 [TABLE]
Two in five said their own email campaigns produced predominantly high-quality leads; 36% said the same of leads that came in through SEO.
Read MoreB2B Marketing Channels By Lead Volume, November 2012 [TABLE]
When it comes to marketing tactics best suited to turning up high volumes of leads, marketers most frequently cited the work of third-party lead generators at 34%.
Read MoreTop Global B2B Marketing Channels, November 2012 [CHART]
Nearly all B2B marketers surveyed reported maintaining email lists and doing search engine optimization.
Read MoreVideo Ad Completion Rates by Video Length, Q1 2011 – Q4 2012 [CHART]
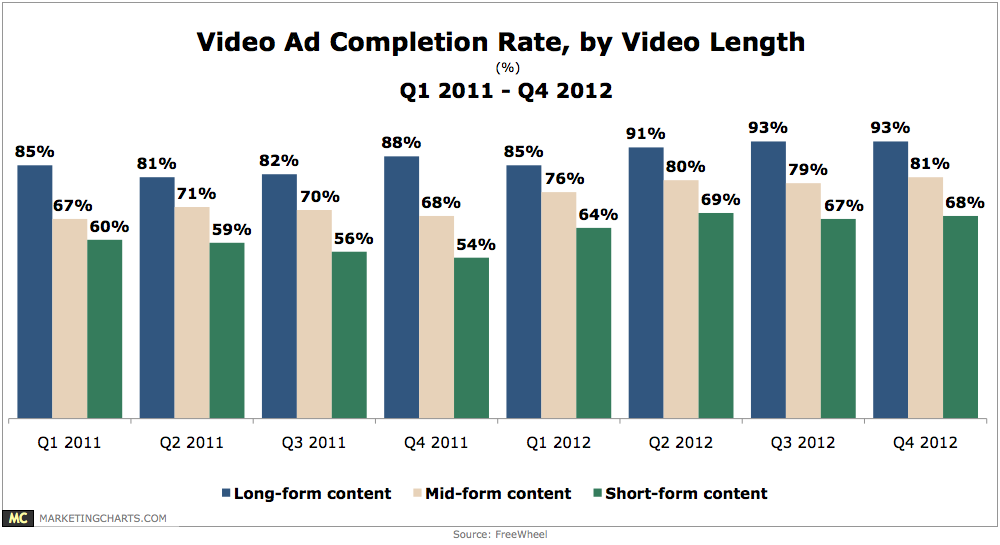
Despite packing in an average of 2.5 more ads per video in Q4 than in Q3 (9.4 vs. 6.9), the completion rate for ads in long-form content (20+ minutes) held steady at 93% in Q4.
Read MoreTop 3 Activities Moving From Desktop To Mobile, February 2013 [TABLE]
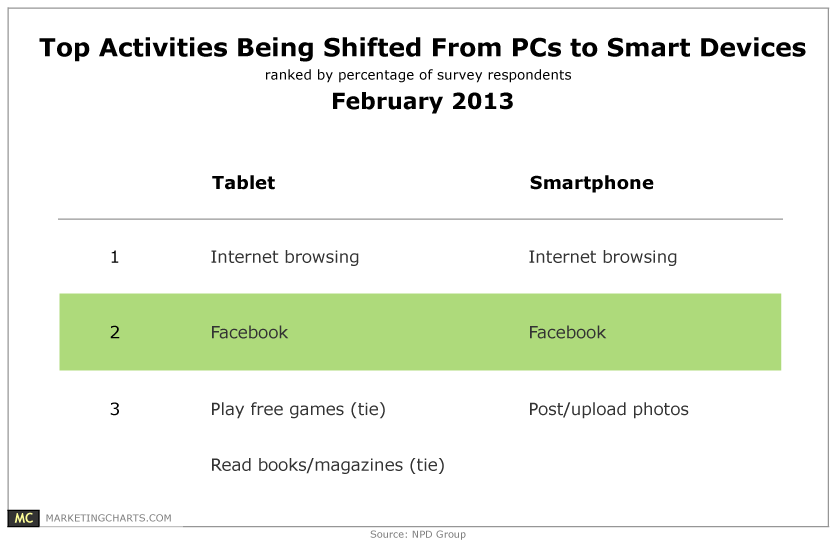
Almost 4 in 10 PC users are now accessing content on their tablets and smart phones instead of their desktops.
Read MoreEyetracking: Cityscape Photograph [HEATMAP]

This eyetracking heatmap provides an overview of the total time all users spent looking at different areas of a picture of a cityscape.
Read MoreCitizen Perceptions Of The Value Of Online & Offline Media, February 2013 [CHART]
Connected consumers in the US place more monetary value on offline media activities or products than online ones ($1,600 per year vs. $1,132).
Read More