Media Consumption
Factors That Would Encourage French TV Viewers To Use Video On-Demand, November 2013 [TABLE]
Lowering the price of available movies and series was the biggest factor that would encourage consumers to use VOD services more regularly (37.6% of respondents).
Read MoreAverage Daily Time Spent With Online Video By Device, 2014 [CHART]
In 2014, 113.4 million US tablet users will watch video programming on their devices at least monthly, representing 77.0% of all tablet users.
Read MoreDemographics Of American Book Readers, January 2014 [TABLE]
Out of the 76% of respondents who had read a book in the past year, nearly seven in 10 had read a physical book, while just 28% had read an ebook.
Read MoreAttitudes Toward Printed vs eBooks By Demographic, March 2014 [TABLE]
US internet users were far more likely to only read printed books than ebooks or a mix of the two.
Read MoreTV Viewing Time By Programming, April 2014 [CHART]
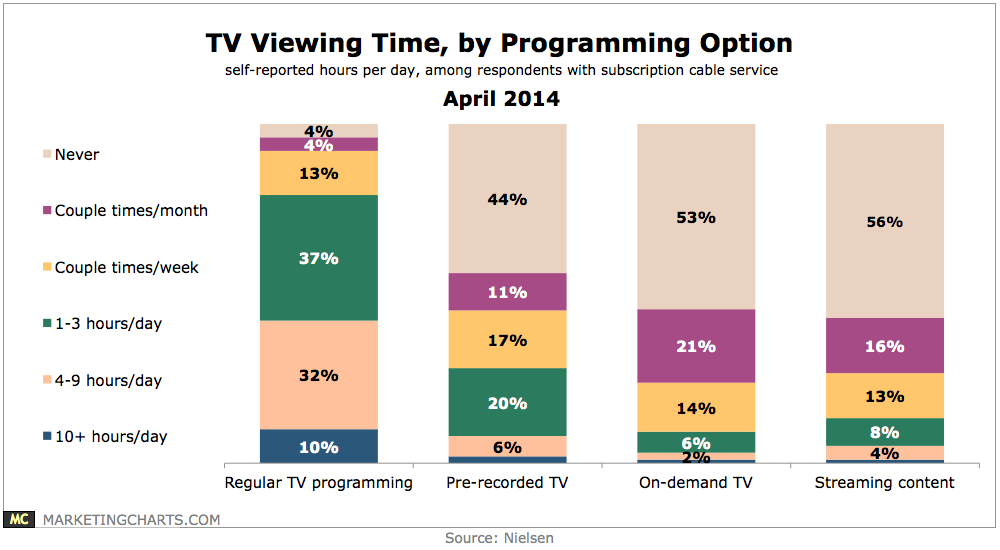
7 in 10 TV households in the US use at least one on-demand service, whether that be a DVR, a Netflix subscription, or video-on-demand from a cable or telco provider,
Read MoreGrowth Of Average Daily Time Spent With Major Media, 2011-2014 [TABLE]
US advertisers are only expected to spend 10 cents per US adult per hour spent on digital media this year—and just 7 cents on mobile—compared with nearly $1 on print ads.
Read MoreAmericans' Daily Consumption Of Major Media, 2010-2014 [CHART]
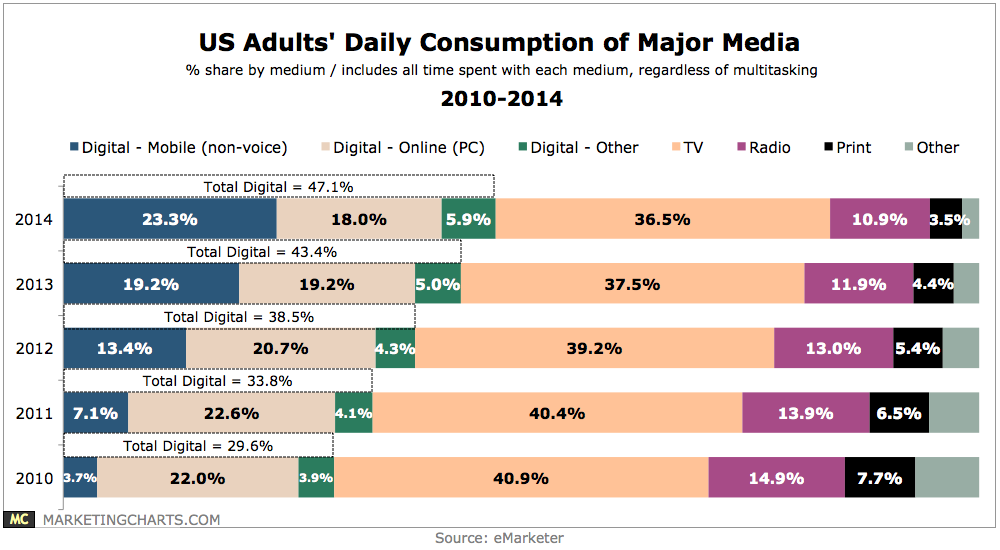
TV remains the single most-consumed medium, averaging 4 hours and 28 minutes per day, though that figure varies widely by age group.
Read MoreAverage Daily Time Spent Watching Video By Device, 2010-2014 [TABLE]
Mobile still accounts for a relatively small share of overall TV/video content viewing time, with an average of 33 minutes per day in 2014 out of a total 5 hours 23 minutes across all devices.
Read MoreShare Of Daily Time Spent With Major Media, 2010-2014 [TABLE]
In 2013, time spent with digital media among US adults surpassed time spent with TV for the first time—with mobile driving the shift.
Read MoreDemographics Of Live TV Viewers, April 2014 [CHART]
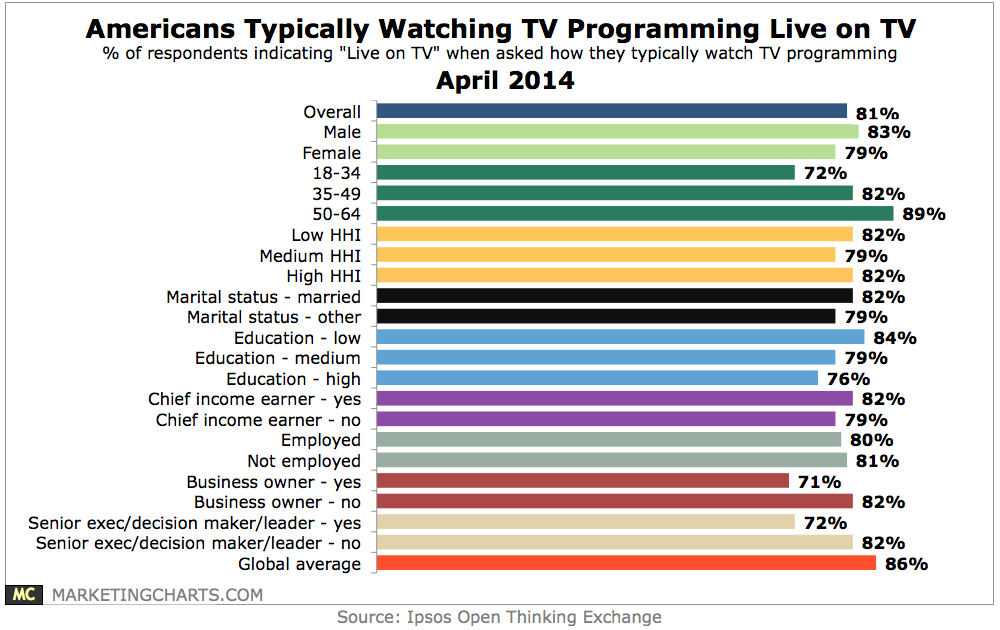
The vast majority of Americans usually watch TV programming the old-fashioned way: live on TV.
Read More