Ad Spending
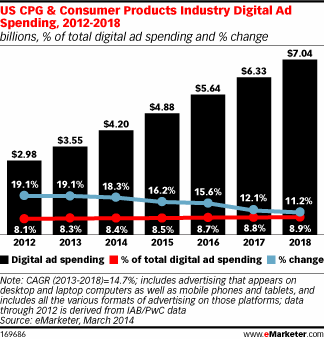
US CPG & Consumer Products Online Ad Spending, 2012-2018 [CHART]
US CPG and consumer products industry’s advertising spending on digital media will hit $4.20 billion in 2014.
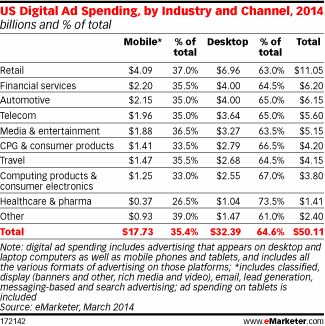
Read MoreUS Online Ad Spending By Industry & Channel, 2014 [TABLE]
Mobile spending levels were roughly similar across industries, with virtually all sectors committing about one-third of spending to the mobile channel, but there were variations by industry.
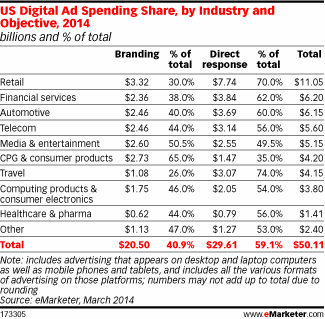
Read MoreUS Online Ad Spending Share By Industry & Objective, 2014 [TABLE]
US advertisers will collectively spend upward of $50 billion on digital advertising in 2014.
Read MoreAir Travelers' Online Behavior [INFOGRAPHIC]
This infographic from Kenshoo illustrates air travelers’ online behaviors.
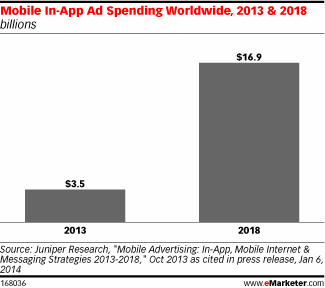
Read MoreGlobal Mobile In-App Ad Spending, 2013 & 2018 [CHART]
In January 2014, it predicted that mobile in-app ad spending worldwide would explode from $3.5 billion in 2013 to $16.9 billion by 2018.
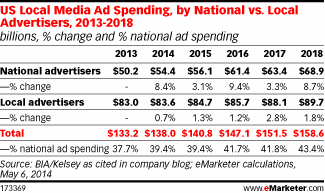
Read MoreUS Local Ad Spending – National vs Local Advertisers, 2013-2018 [TABLE]
National advertisers will up US local media ad spending by 8.4% in 2014, from $50.2 billion in 2013 to $54.4 billion—or nearly 40% of all local media ad investments.
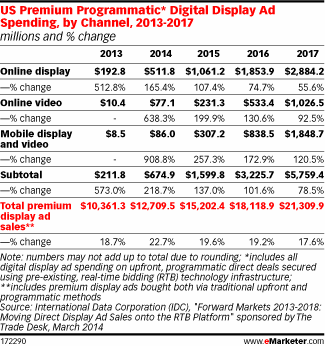
Read MoreUS Premium Programmatic Ad Spending By Channel, 2013-2017 [TABLE]
Spending on premium programmatic online display advertising will rise 165.4% in the US this year.
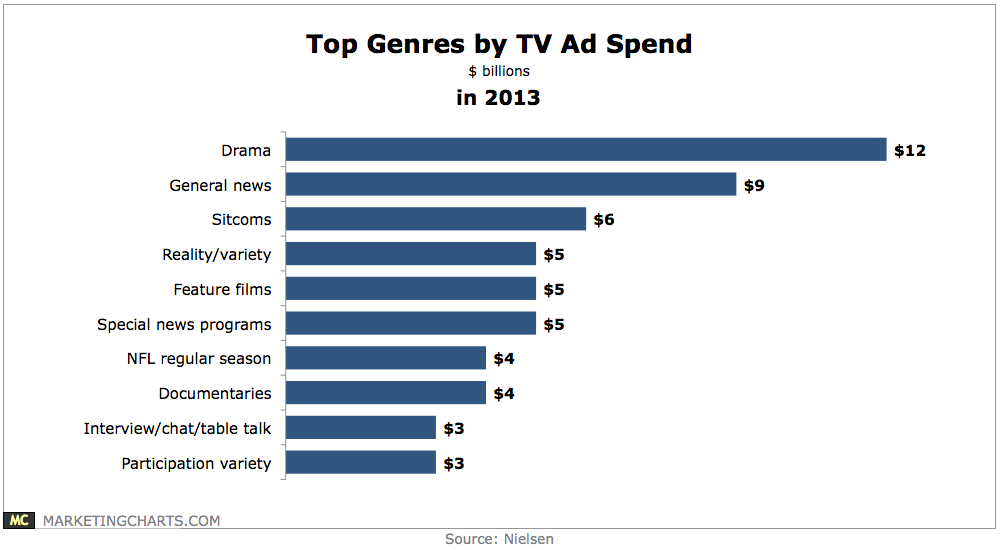
Read MoreTop Genres By TV Ad Spend, 2013 [CHART]
Drama ($12 billion in ad spend) netted the biggest share of the $78 billion TV ad spending pie last year, at more than 15%.
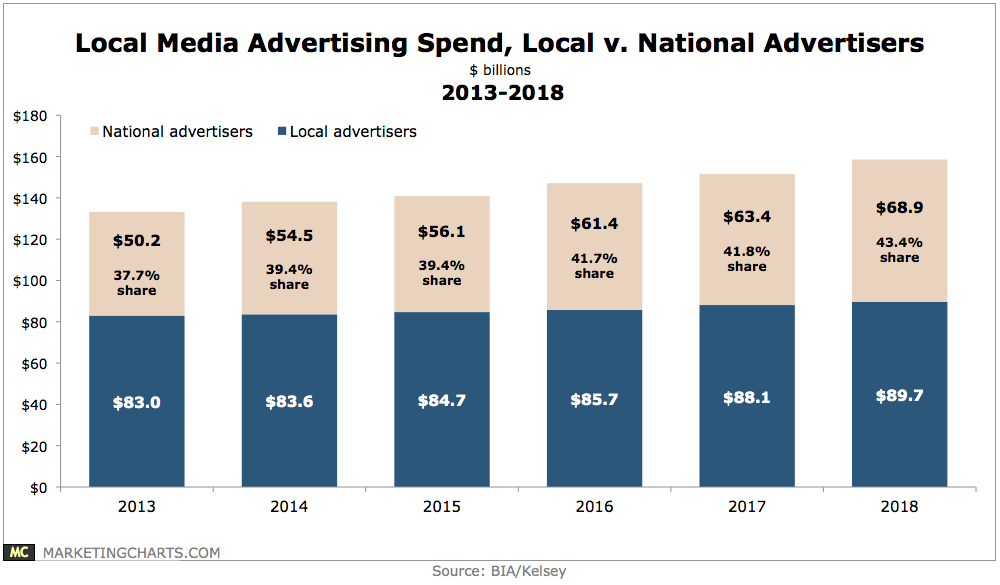
Read MoreLocal Media Ad Spending By Local vs National Advertisers, 2013-2018 [CHART]
National advertisers are projected to increase their spending on local media advertising by almost 9% this year, to $54.4 billion, representing 39.4% of total local media advertising dollars.
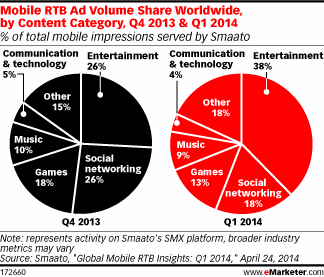
Read MoreGlobal Mobile RTB Ad Volume Share By Content Category, Q4 2013 & Q1 2014 [CHART]
The entertainment and media industry claimed 37% of total mobile RTB ad spending on the SMX platform worldwide in Q1 2014.
Read More