Posts by derickson
Mobile Payment Adoption, April 2013 [CHART]
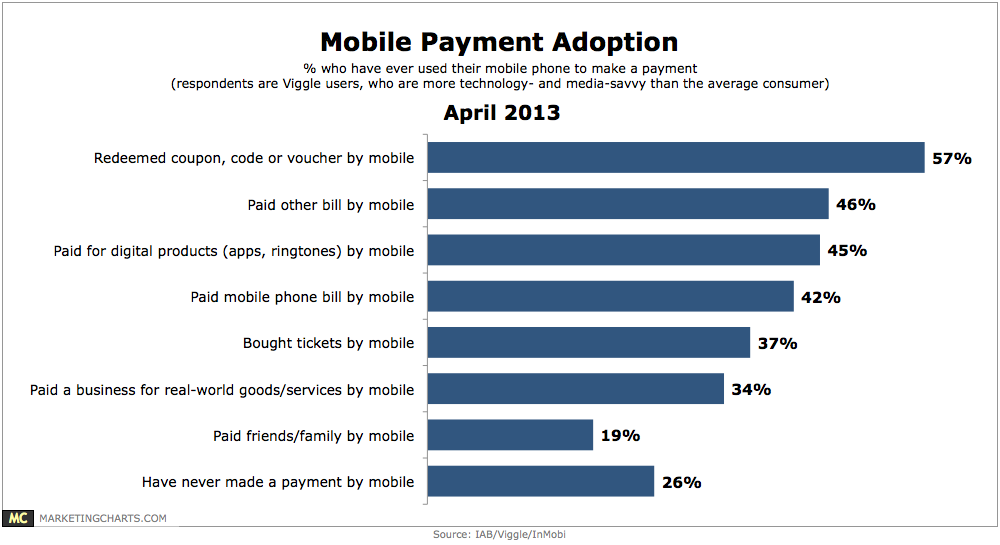
57% of tech-savvy respondents have redeemed a coupon, code or voucher by mobile, while more than 4 in 10 have paid for digital products via their device.
Read MorePrint Magazine Ad Trends, Q1 2012 vs Q1 2013 [CHART]
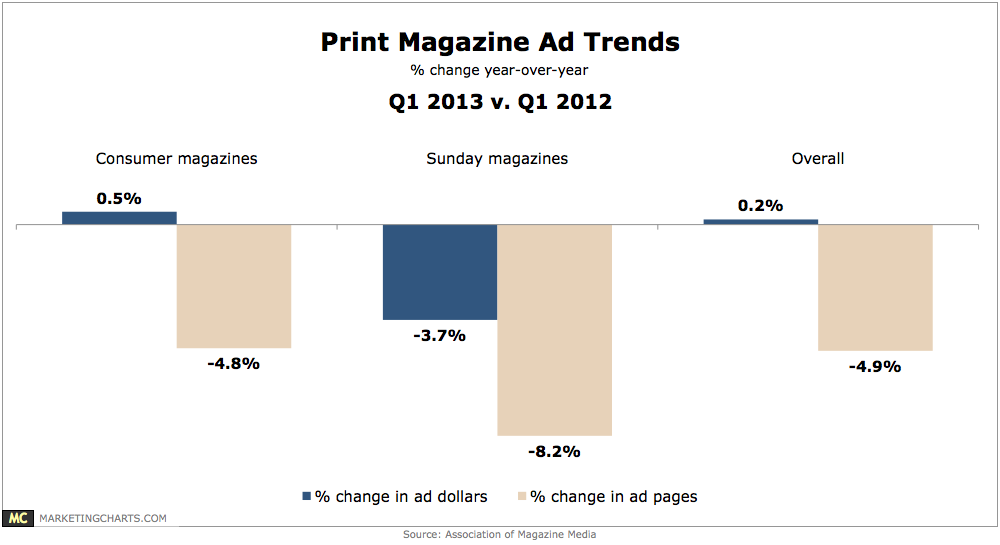
Consumer magazine ad revenue (print only) grew by 0.5% year-over-year in Q1 2013 to reach $4.13 billion.
Read MoreCompletion Rates By Length Of Mobile Rich Media Video Ads, April 2013 [CHART]

Completion rates for very short videos (less than 30 seconds) had the lowest completion rate (35.8%), behind even the longest ads (150 seconds and longer), which had a roughly 50% completion rate.
Read MoreWhy American Women Use Mobile For Shopping, March 2013 [CHART]
Just over a majority of American women said they used their mobile device to find store locations and hours.
Read MoreHow American Women Research Products, March 2013 [CHART]
Only 6% of American women reported still researching products primarily in-store, while another 5% asked friends and family for recommendations most often.
Read MoreSecond Screen TV-Related Behavior, April 2013 [CHART]
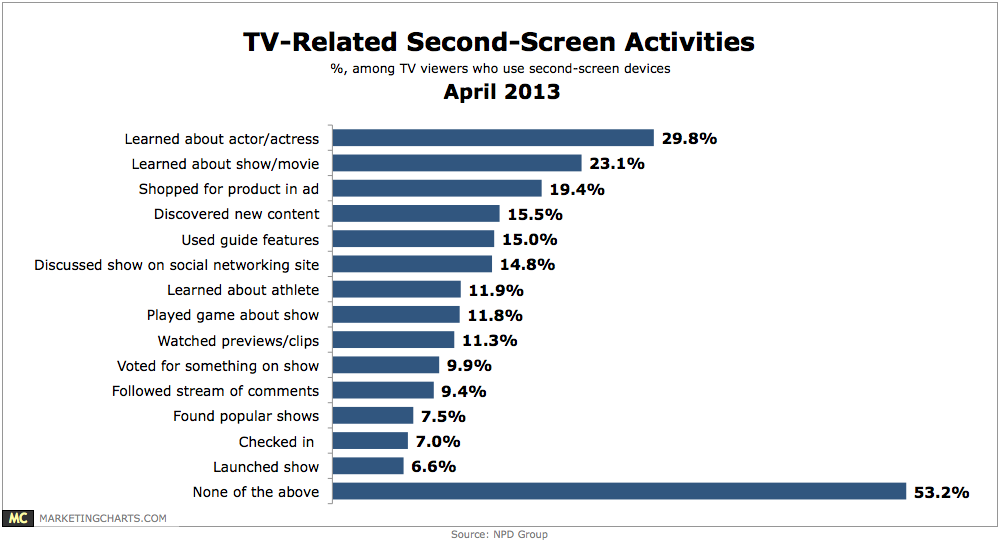
Among the most common is shopping for a product seen in an ad, by 19.4% of TV watchers who engage in second-screen activities.
Read MoreBudget Increases For Online Video, 2012 vs 2013 [CHART]
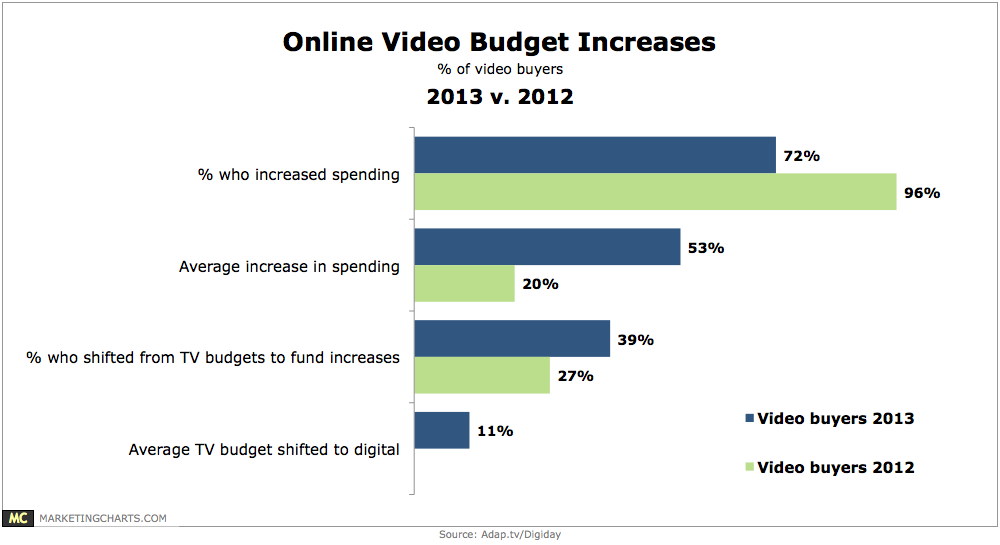
A recent study by Nielsen and the IAB recommended moving 15% of TV budgets to online video in order to increase reach at a lower cost.
Read MoreTeen Spending Behavior, April 2013 [TABLE]
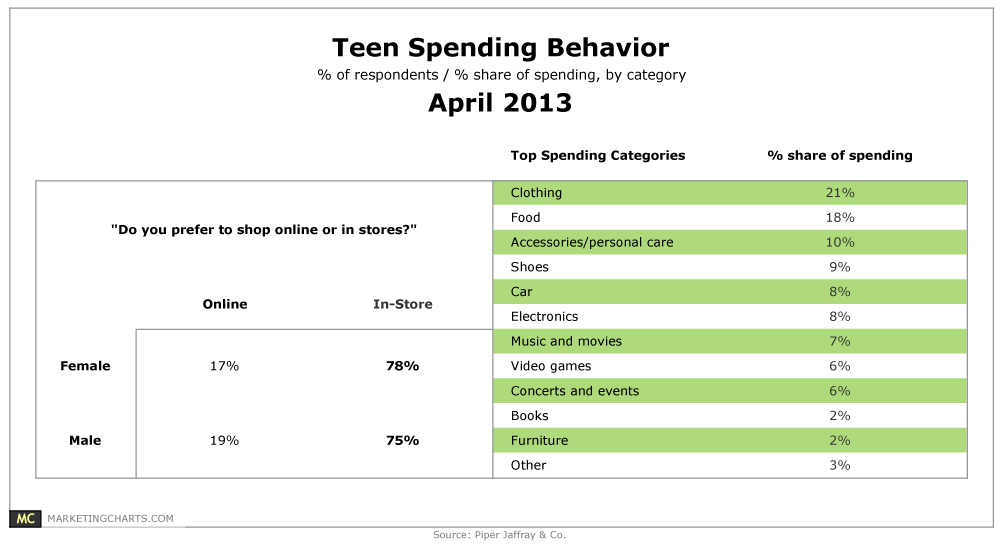
More than 3 in 4 teens shop online.
Read MoreMobile Share Of Search Traffic, Q1 2013 [CHART]
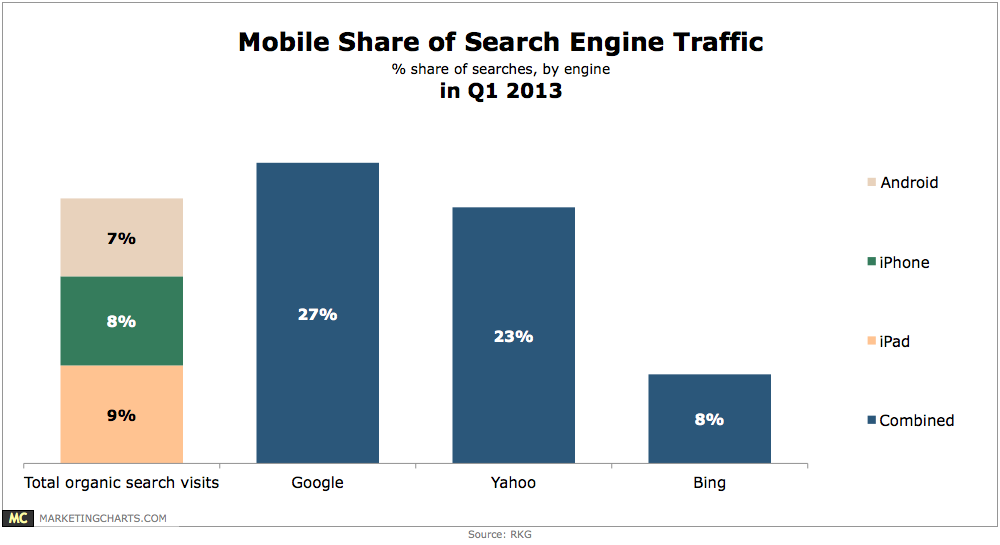
Tablets and smart phones combined accounted for roughly 24% of organic search visits in Q1.
Read MoreBroadcast TV Content Completion Rates Online By Device, 2012 [CHART]
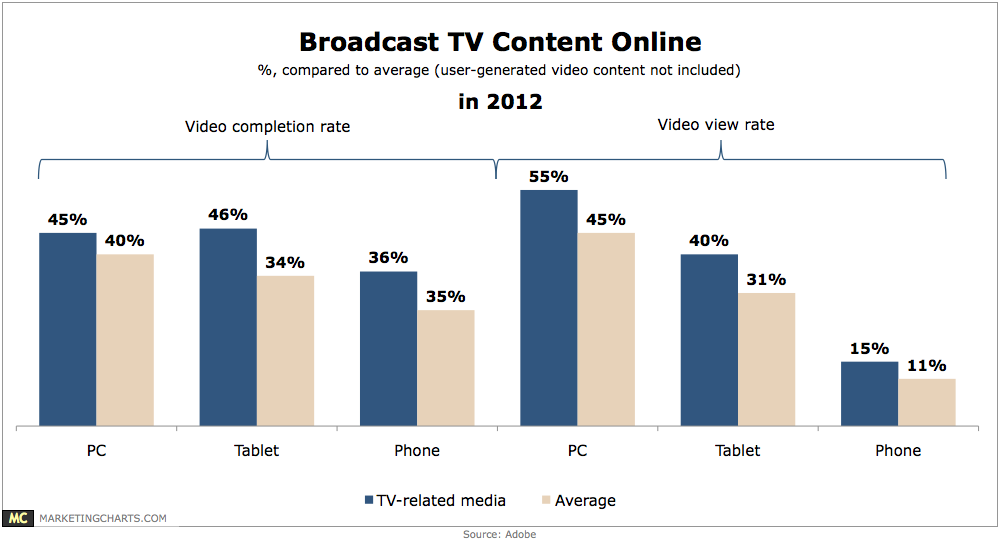
Compared to the average, completion rates for TV-related content (such as full episodes of TV shows) are 12.5% higher on PCs (45% vs. 40%), 31.4% higher on tablets (46% vs. 35%), and 33.3% higher on mobile phones (36% vs. 27%).
Read More