Posts by derickson
Multitainment Behavior Of World Cup Viewers [CHART]
Facebook tied with SMS for the top way US smartphone users following the FIFA World Cup planned to communicate with others about games while watching.
Read MoreTop Benefits Of Professional Content On LinkedIn, June 2014 [CHART]
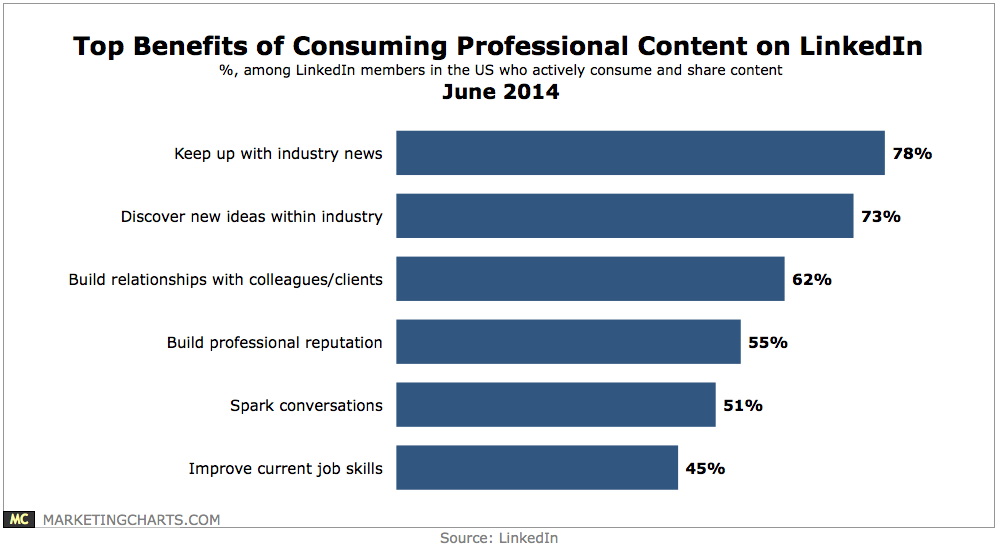
A leading 78% consume content in order to keep up with industry news, while 73% do so to discover new ideas within the industry.
Read MoreGlobal Newspaper Circulation & Advertising Trends By Region, 2013 [CHART]
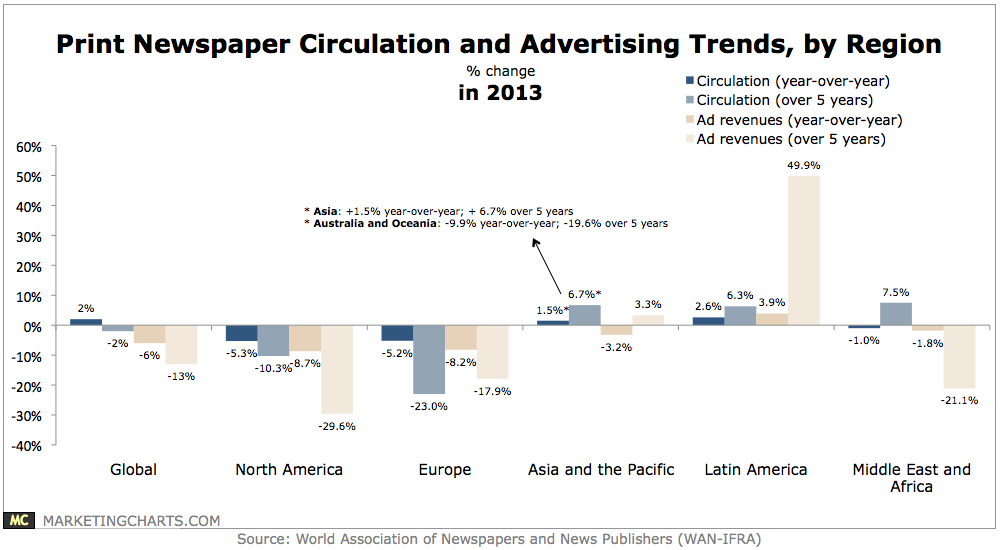
Print newspaper circulation around the world actually increased by 2% year-over-year in 2013, as gains in Asia and Latin America offset losses in other regions.
Read MoreFacebook Brand Post By Time of Day, June 2014 [CHART]

The most popular hour for brands to post on Facebook is 12-1PM EST.
Read MoreUS Online Video Ad Spending Forecast, Desktop vs Mobile, 2014-2018 [CHART]
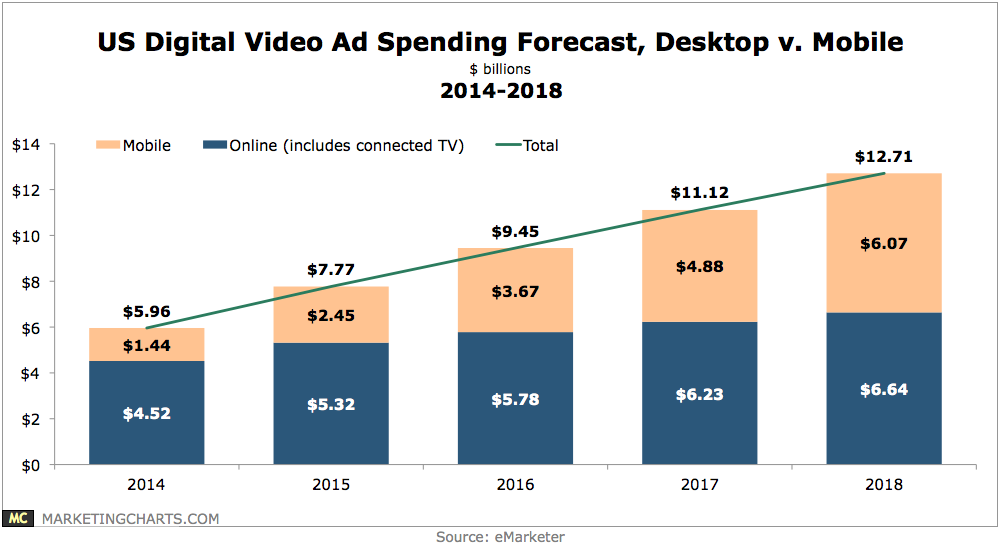
Marketers will spend more than $1.4 billion on mobile video ads this year, or close to one-quarter of total digital video ad spending.
Read MoreFrench 2014 World Cup Watchers By Device [CHART]
Out of the 57% of internet users in France who said they would follow at least some of the tournament’s games, just 9% planned to use a smartphone to do so.
Read MoreLanguage In Which US Hispanic Millennials Regularly Consume Content, March 2014 [CHART]
18.7% of Hispanics ages 18 to 34 would be interested in receiving advertisements on their mobile devices, compared with 8.5% of non-Hispanics the same age.
Read MoreLikelihood Pay TV Subscribers Will Cut The Cord, 2011-2014 [TABLE]
The percentage of pay TV subscribers who were likely to cancel their cable services had held steady between 2011 and 2014.
Read MoreReasons People Watch TV Everywhere, November 2013 [CHART]
Flexibility is the main reason today’s busy, on-the-go consumers are taking advantage of TV Everywhere.
Read MoreMonthly TV Everywhere Videos Viewed By Device, Q1 2013 & Q1 2014 [CHART]
The number of unique TV Everywhere visitors in the US rose 157% between Q1 2013 and Q1 2014 and 49% between Q4 2013 and Q1 2014.
Read More