Posts by derickson
B2B Buying Process Timeline [TABLE]
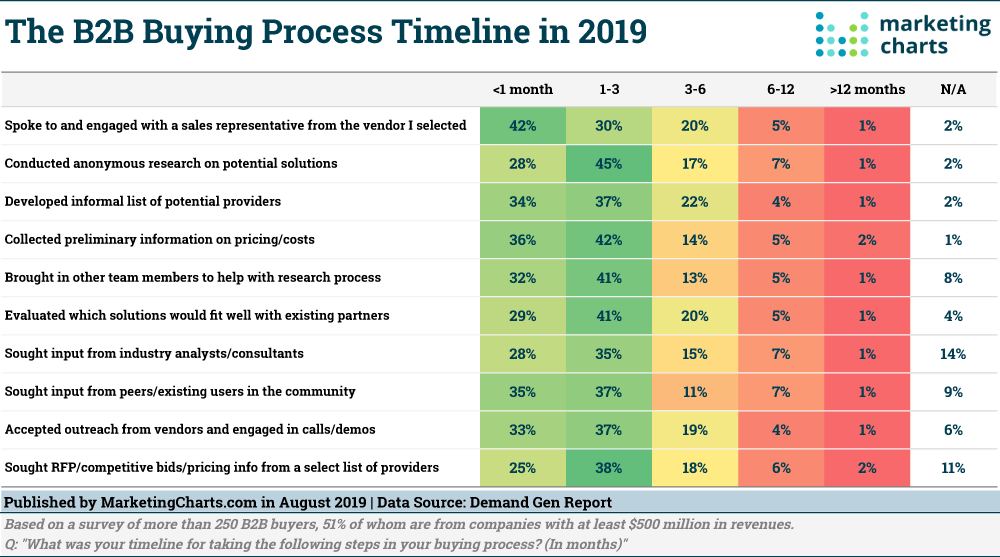
Three-quarters of B2B buyers say they are spending more time over the past year researching purchases, according to Demand Gen Report’s 2019 B2B Buyers Survey Report. While this number is up slightly from last year (72%), other results from the survey also indicate that more buyers are engaging with vendors early on in their buying process.
Read MoreUses Of Social Media Analytics [CHART]
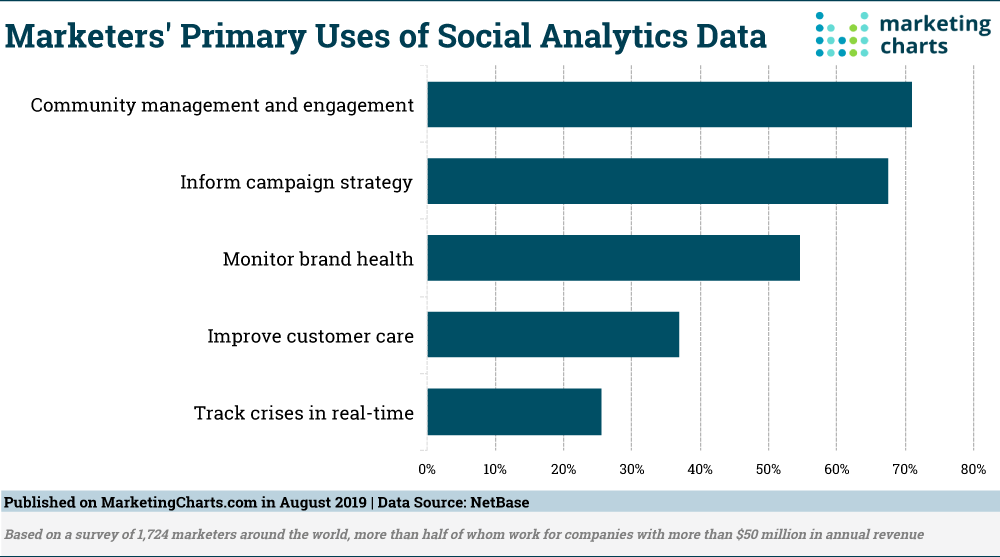
The majority of marketers agree that social media analytics is an essential business development tool, per a report from NetBase, which surveyed more than 1,700 marketers, half of whom are from companies with more than $50 million in annual revenues
Read MoreAds Ignored By Podcast Listeners [CHART]
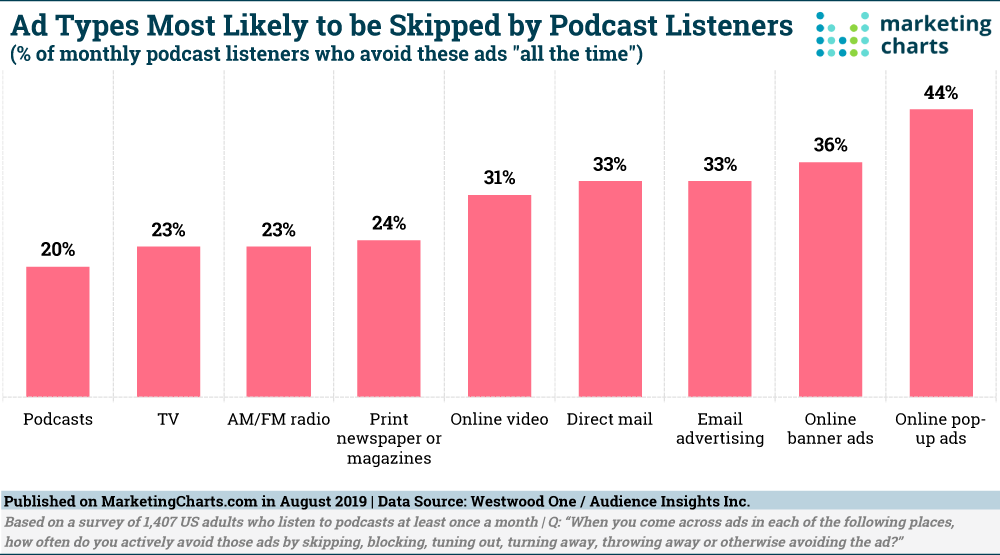
In the past two years, US podcast advertising revenues have more than doubled, with spend expected to reach an estimated $678.7 million in 2019.
Read MoreAttitudes Towards Brands That Use Emojis [CHART]
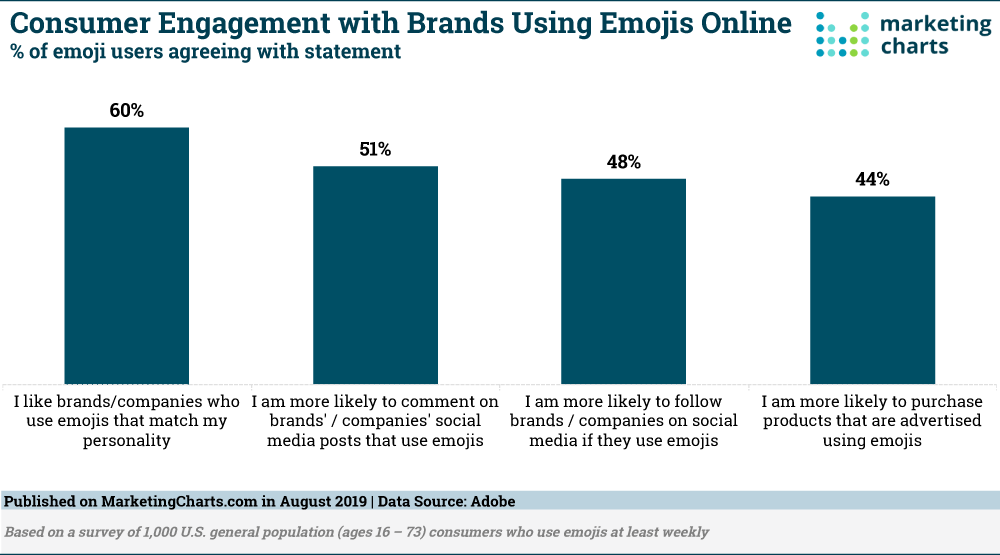
Instagram posts have been found to generate more interaction when they include at least one emoji, making emojis a surprisingly useful engagement tool as opposed to just a way to dress up an otherwise dull message.
Read MoreGDPR's Effect On Marketing [INFOGRAPHIC]
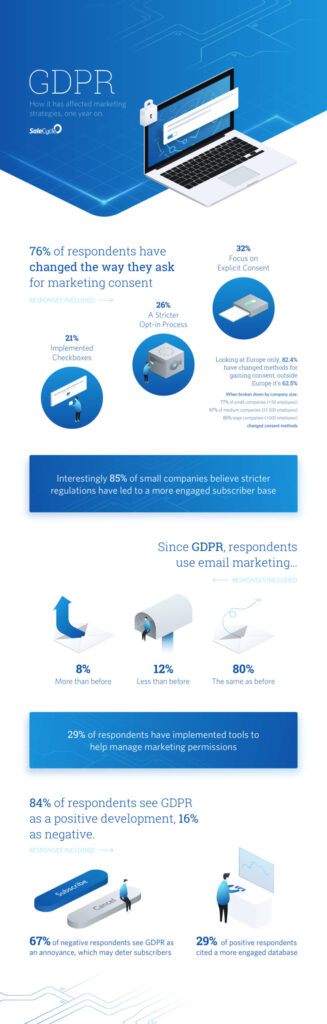
This infographic from SaleCycle illustrates how the General Data Protection Regluation has influenced marketing.
Read MoreGreat About Us Pages [INFOGRAPHIC]
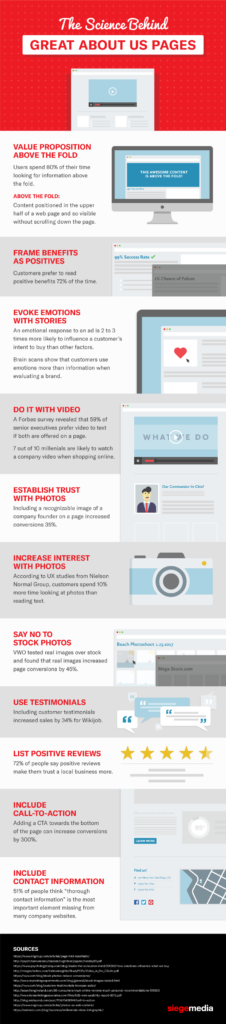
This infographic from Siege Media illustrates 11 factors that contribute to great About Us pages.
Read MoreDigital Illiteracy [CHART]
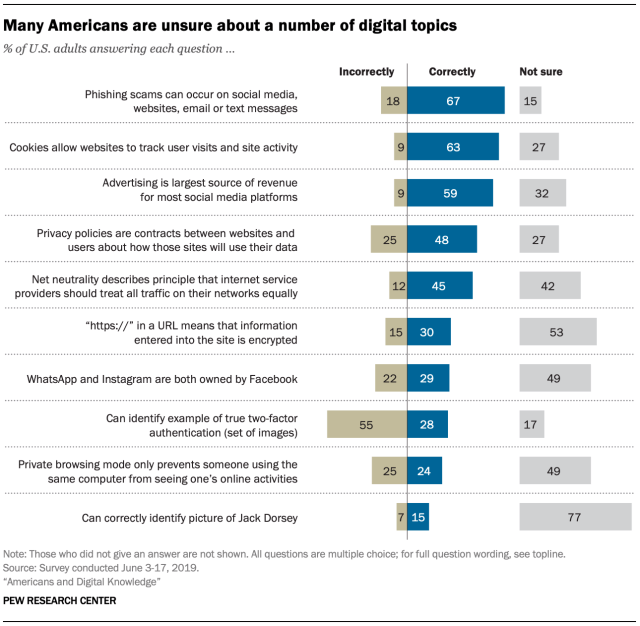
A Pew Research Center survey finds that Americans’ understanding of technology-related issues varies greatly depending on the topic, term or concept.
Read MoreEmail Users, 2018-2022 [CHART]
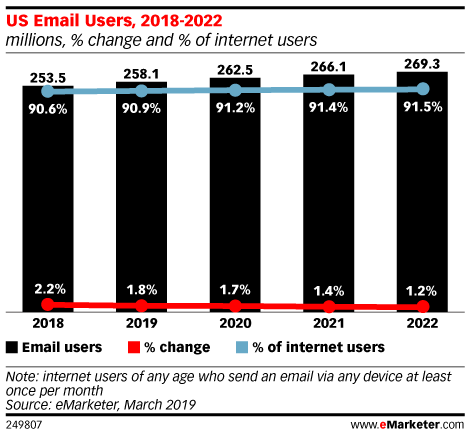
The percentage of American internet users who have sent an email via any device at least once a month will remain practically the same, rising only from 90.6% in 2018 to an estimated 91.5% in 2022.
Read MoreAdobe AI-Powered Innovations

Watch 11 demonstrations of Adobe’s artificial intelligence technology, called Sensei, presented at the 2019 Adobe Max conference.
Read MoreInstagram Story Performance Benchmarks [TABLE]
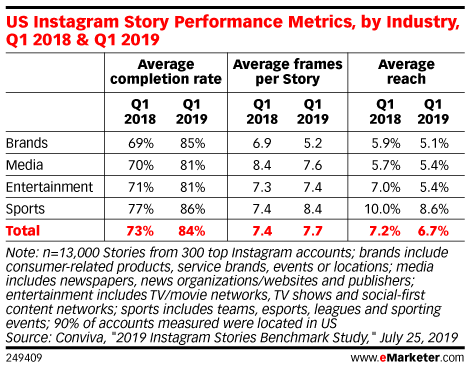
There is little data on consumer attitudes toward Stories ads, but there is research to suggest that they perform reasonably well.
Read More