Posts by derickson
Net US Online Ad Revenue Share By Company, 2012-2016 [TABLE]
Google alone already accounts for more than 10% of all advertising spending in the US.
Read MoreUS Online Ad Spending By Channel, 2012-2018 [TABLE]
Strong, steady growth in mobile advertising will push digital ads to represent nearly 30% of all US ad spending this year.
Read MoreTotal US Ad Spending Share By Media, 2012-2018 [TABLE]
US adults will spend an average of 2 hours 51 minutes per day with mobile devices this year.
Read MoreTotal US Ad Spending, 2012-2018 [CHART]
Total ad investments will jump 5.3% to reach $180.12 billion, achieving 5% growth for the first time since 2004, when ad spending increased 6.7%.
Read MoreTop-Performing CEOs [INFOGRAPHIC]
This infographic by Domo and CEO.com provides a detailed illustration of today’s most successful leaders.
Read MoreFemale Sales Professionals [INFOGRAPHIC]
This infographic by LinkedIn illustrates trends related to saleswomen during the past decade.
Read MoreOrder In Which People Pay Attention To Search Results That Include Video Thumbnails [FIXATION MAP]
This heatmap illustrates the order in which search engine users fix their attention on search results that include video thumbnails.
Read MoreHow People View Search Results That Contain Video Thumbnails [HEATMAP]
This heatmap illustrates how search engine users pay attention to search results that include video thumbnails.
Read MoreHow People View Search Results With Social Annotations [HEATMAP]
This heatmap illustrates how search engine users pay attention to search results that include social annotations.
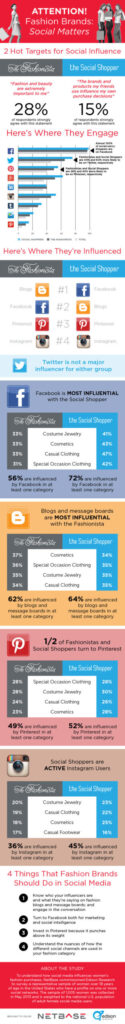
Read MoreTypes Of Content Brands Develop For Social Media [CHART]
Posts and videos are the most widely used types of content on social, as 96% and 89% of brands have produced them, respectively.
Read More