Posts Tagged ‘Women’
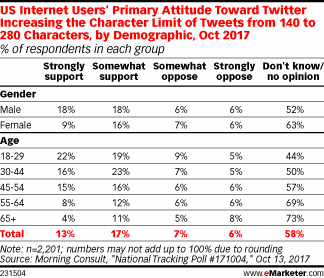
Attitudes Toward Twitter's Increased Character Count [TABLE]
41% of respondents ages 18 to 29 having at least a somewhat positive reaction to the change, and just 14% expressing reservations.
Read MoreYouTube Statistics, 2017 [INFOGRAPHIC]
This infographic from filmora illustrates some amazing facts, figures and statistics about YouTube for 2017.
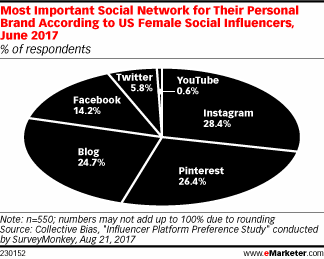
Read MoreTop Channels For Female Social Influencers [CHART]
Influencer-focused content marketing company Collective Bias polled its stable of largely female influencers to get a sense of their preferred social networks.
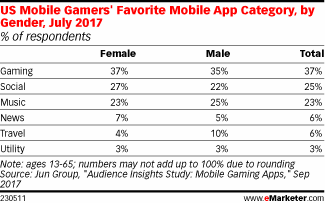
Read MoreGamers Favorite Mobile App Categories By Gender [TABLE]
Jun Group’s survey found that a slightly higher percentage of females named games as their favorite type of mobile app than did males.
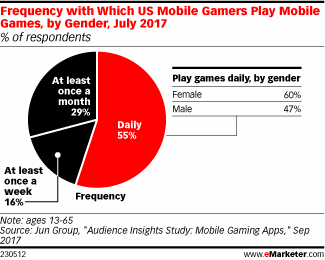
Read MoreFrequency Of Mobile Gaming By Gender [CHART]
New data suggests that females are playing mobile games at a higher frequency than males in the US.
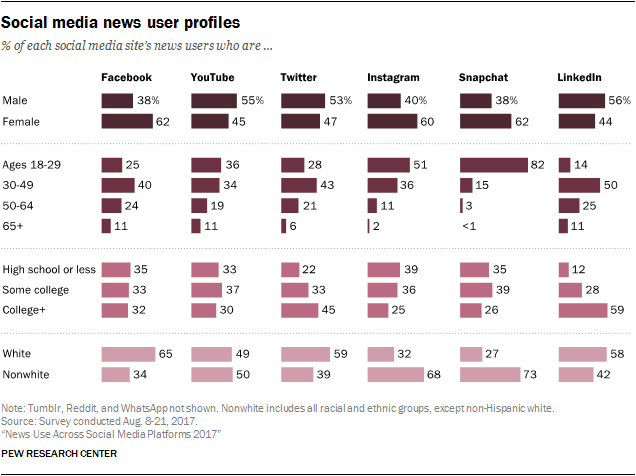
Read MoreSocial Media Demographics By Channel [CHART]
There are some key differences in the demographic makeup of each site’s news users. Instagram and Snapchat news consumers are considerably more likely to be nonwhite and younger.
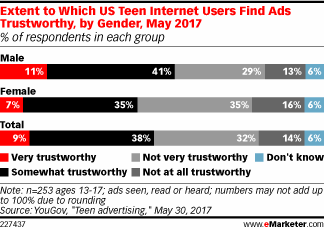
Read MoreTeens' Trust In Ads By Gender [CHART]
Teens in the US are split when it comes to trusting the advertisements they see, read or hear.
Read MoreOnline Reviews & Ratings [INFOGRAPHIC]
This infographic from Websitebuilder.org illustrates the facts and importance of online consumer reviews and ratings to a wide variety of businesses.
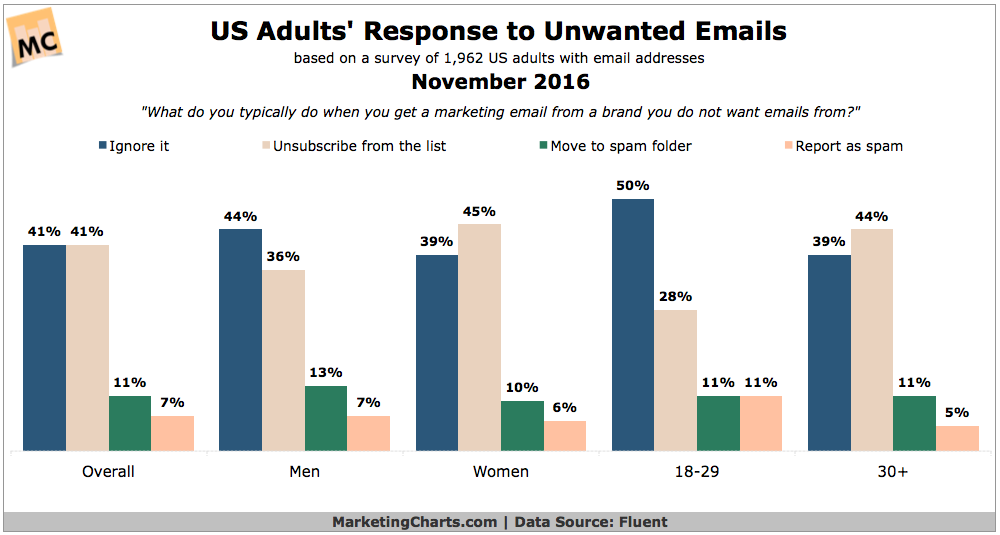
Read MoreHow People React To Spam [CHART]
Faced with a marketing email from a brand they don’t want emails from, US adults are as likely to unsubscribe from the list (41%) as they are to ignore the email (41%).
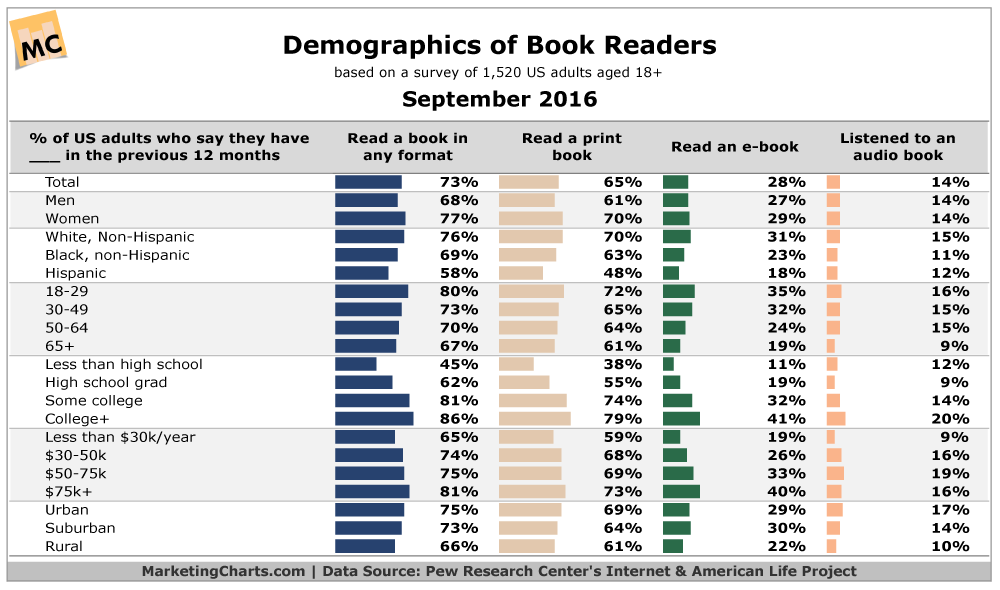
Read MoreDemographics Of US Book Readers [CHART]
The percentage of American adults who read books has remained relatively unchanged in the past few years.
Read More