Posts Tagged ‘Travel Marketing’
Americans' Attitudes Toward Select Businesses & Industries, Q1 2014 [CHART]
Just 37% of Americans have a positive view of the advertising and public relations industry.
Read MoreFacebook Post Interaction Rates By Industry, 2013-2014 [CHART]
The retail industry topped all others tracked in Q3 post interaction rates, with its 4.18% average representing a 13% increase over the year-earlier period.
Read MoreMobile App Consumption Increases By Category, 2013-2014 [CHART]
The overall amount of time spent with mobile applications grew by 21% between August 2013 and last month.
Read MoreMarriott Goes Virtual & GoPro Goes Pro [PODCAST]
Episode 66: David and BL discuss Facebook anonymity, the Hong Kong protesters, GoPro NHL deal, Marriott’s virtual reality play, and much more.
Read MoreGmail Tab Delivery & Read Rates By Industry [CHART]
Gmail’s tabbed inbox seems to be having a positive influence on promotional emails’ inbox placement rates.
Read MoreEmail Inbox Placement Rate By Industry [CHART]
Deliverability rates by industry showed not only clear winners and losers, but how inconsistent inbox placement rates are when looking beyond the global average.
Read MoreContent On Which People Comment Anonymously By Type, June 2014 [CHART]
40% of US internet users said they had commented anonymously.
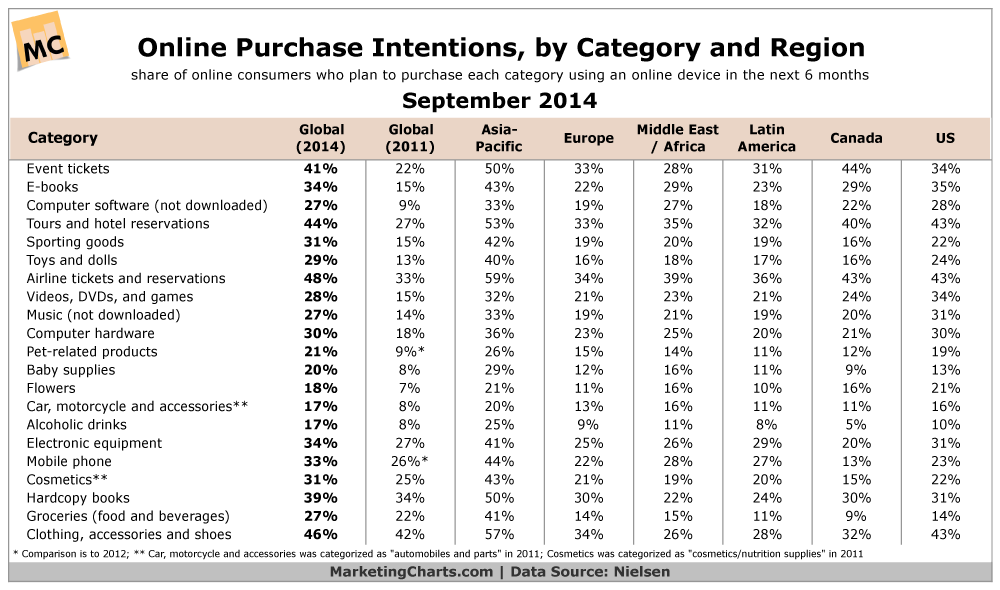
Read MoreOnline Purchase Plans By Category & Region, September 2014 [TABLE]
Consumers around the world tend to be more likely to shop for than buy products online, although the gap between browsing and buying is relatively small for most product categories.
Read MoreEffect Of Notifications On Opening An App By Category, July 2014 [CHART]
Mobile apps grab over half of US internet users’ time spent with digital media, and app retention and engagement are up.
Read MorePhablet User Persona [CHART]
Compared to the average mobile user, Phablet users over-index in the Social Influencer Persona by 2.4x.
Read More