Posts Tagged ‘Travel Marketing’
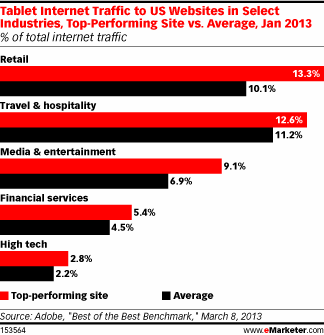
Tablet Traffic To US Websites Of Select Industries, January 2013 [CHART]
The top-performing retailer site studied got 13% of internet traffic from tablets.
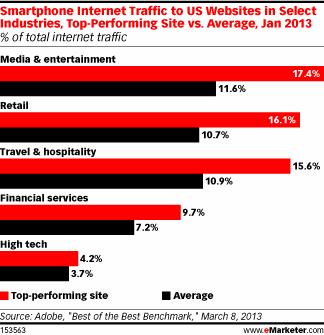
Read MoreUS Smart Phone Website Traffic To Select Industry Websites, January 2013 [CHART]
The top-performing site that got the greatest share of traffic from smart phones was in the media and entertainment category.
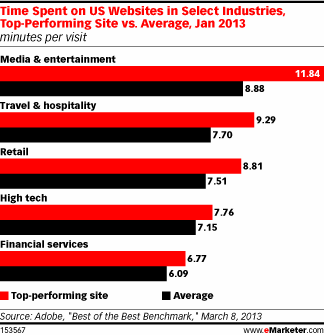
Read MoreTime Spent On US Websites By Select Industries, January 2013 [CHART]
The top-performing media and entertainment site kept users on the site for about 12 minutes per visit.
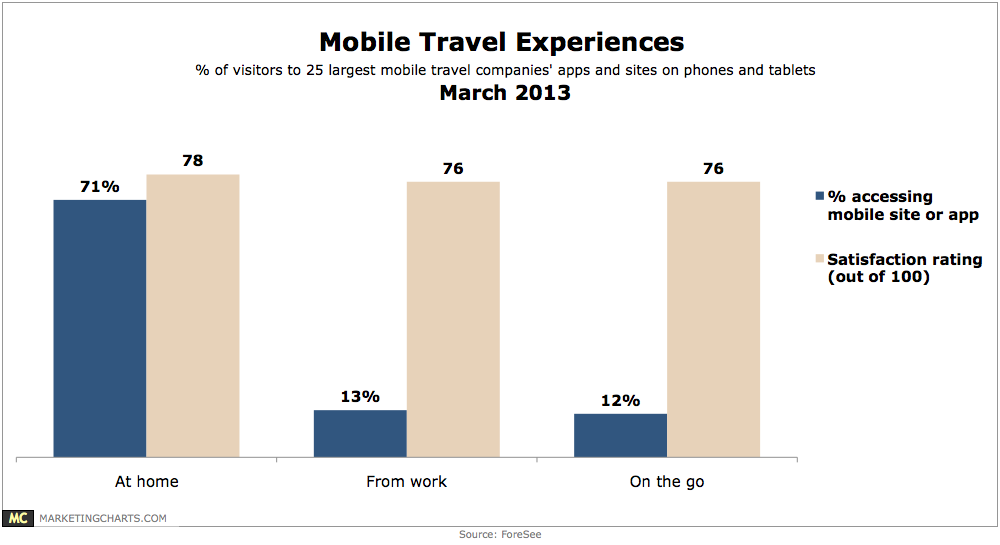
Read MoreWhere People Use Mobile Travel Sites & Apps, March 2013 [CHART]
71% of consumers accessed travel companies mobile websites or apps from home, compared to 13% who accessed from work and just 12% who visited them on-the-go.
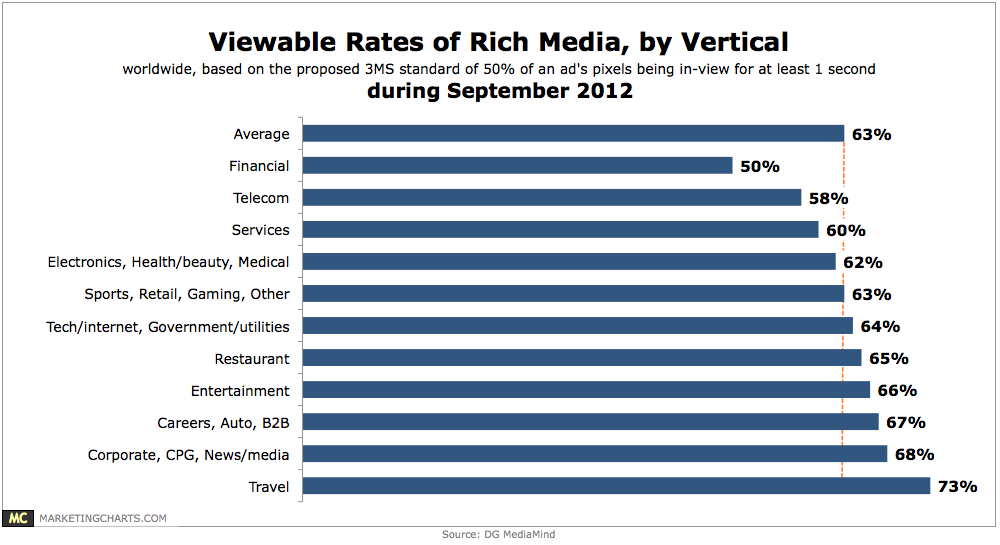
Read MoreRich Media Viewability By Vertical, September 2012 [CHART]
63% of rich media ads are viewable.
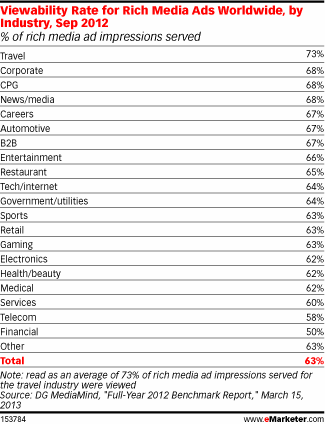
Read MoreViewability Rate For Rich Media Ads By Industry, September 2012 [TABLE]
Rich media ads purchased by firms in the travel industry were most likely to be viewable, at 10 percentage points above average, while those in the financial vertical were only seen half the time.
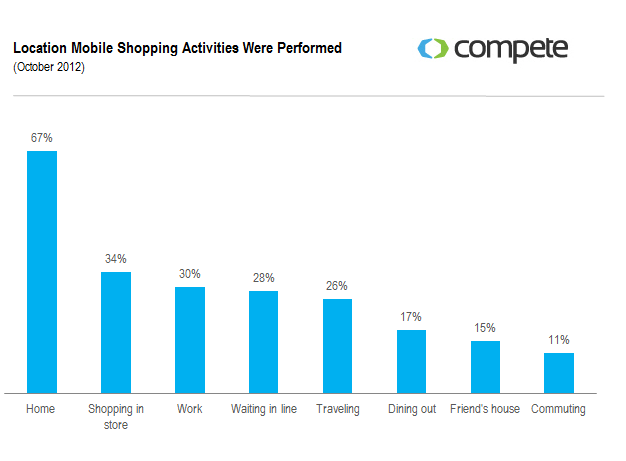
Read MoreWhere People Mobile Shop, October 2012 [CHART]
Nearly 1 in 5 consumers performs shopping activities on their phone while dining out.
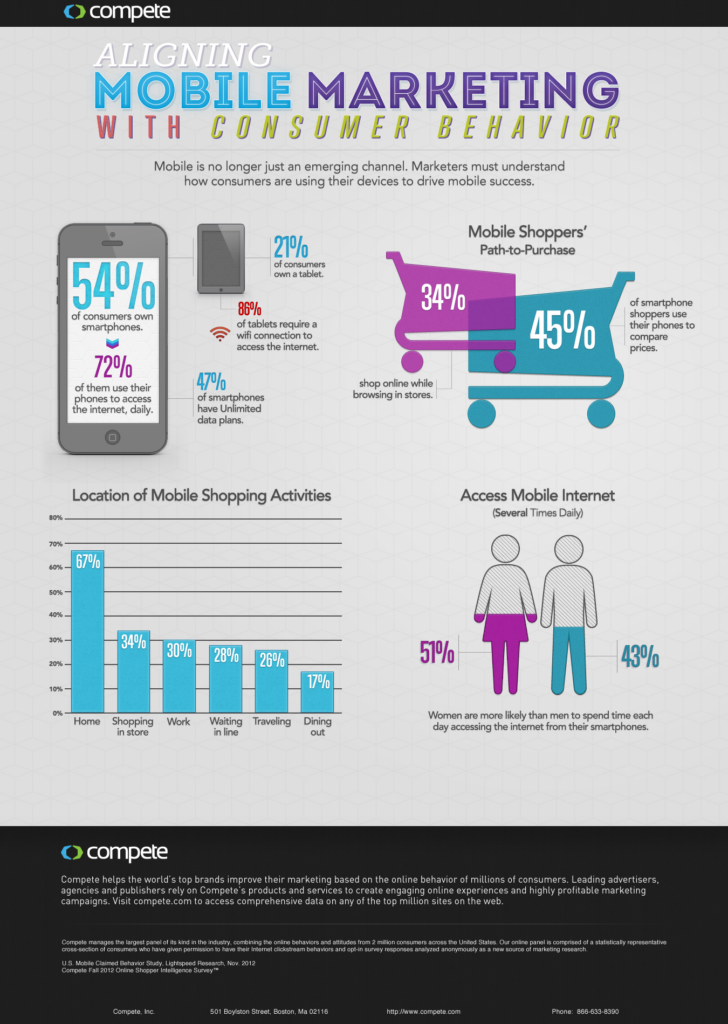
Read MoreConsumer Behavior & Mobile Marketing [INFOGRAPHIC]
This infographic from LightSpeed Research suggests that mobile should no longer be thought of as an emerging channel for consumers.
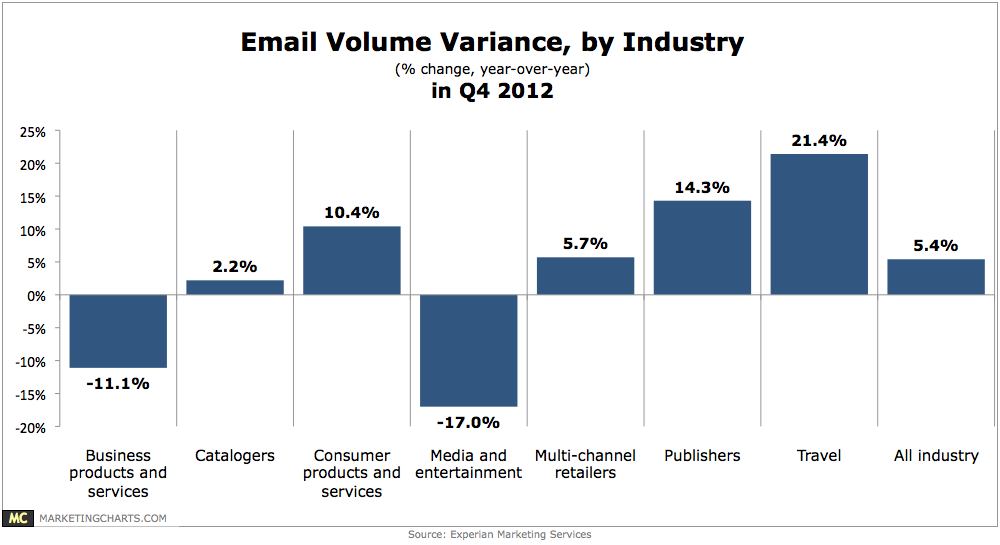
Read MoreEmail Volume Variance By Industry, Q4 2012 [CHART]
Email volume rose 5.4% year-over-year in Q4.
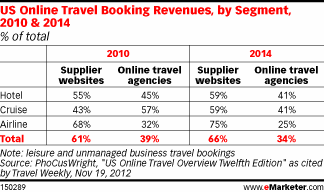
Read MoreUS Online Travel Booking Revenues By Segment, 2010 & 2014 [TABLE]
Almost 60% of online cruise bookings in 2014 will come via supplier websites, with the remaining purchased via online travel agencies.
Read More