Posts Tagged ‘Television’
YOY Change In Broadcast Primetime TV Viewership [CHART]
Summer 2012 primetime TV impressions were up for broadcast networks, but down in ad-supported cable.
Read MoreTime Spent Watching Video By Device & Cable Subscriber Status, August 2012 [CHART]
Cable subscribers spent 59.5 hours in August watching TV shows and movies on a variety of devices, vs. only about half as much time for non-subscribers.
Read MoreOnline Videos Subscribers By Cable vs. Non-Cable Users, August 2012 [CHART]
US subscribers and nonsubscribers to cable TV were almost equally likely to use online video subscription services, at 49% and 48%, respectively.
Read MorePre-Shopping Media By Reach, September 2012 [CHART]
AM/FM radio delivers the largest reach of any medium before the peak shopping hour of 1PM – 2PM.
Read MoreReaching Affluents Through Traditional Media [TABLE]
Although affluent Americans are spending more time online and adopting mobile devices at a greater rate, traditional media channels still have great reach among these estimated 59 million US adults living in households with at least $100,000 in annual household income .
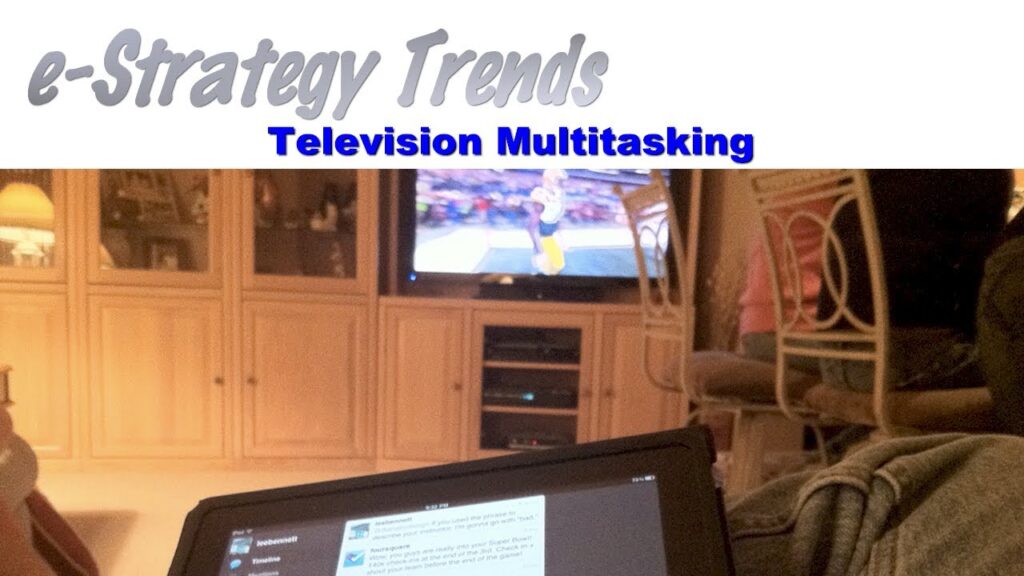
Read MoreLeading Multitainment Activities, Q2 2012 [CHART]
Simultaneous usage was more task-based than entertainment-focused.
Read MoreMultitainment By Device Pairs [TABLE]
Devices most often used for entertainment—TVs and tablets—saw the greatest simultaneous usage: 77% of all TV interactions among US connected device users.
Read MoreTypes Of TV Use, Q1 & Q4 2011 vs Q1 2012 [CHART]
The number of American homes with a wired cable subscription fell 4.1% year-over-year in Q1 2012, from 62.7 million to 59.8 million.
Read MoreNetflix Users' Television Consumption Behavior [CHART]
68% say Netflix makes no difference to their viewing of new episodes of dramas on broadcast or cable TV networks.
Read More


