Posts Tagged ‘Television’
Share Of Time Spent Online By Device & Content, January 2014 [VIDEO]
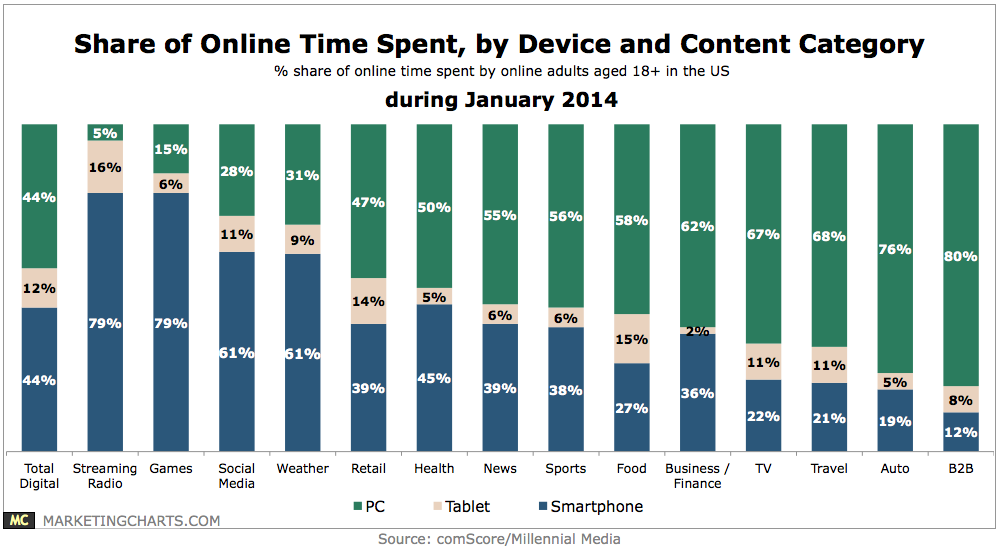
Time spent accessing the internet on smartphones matched online time spent with PCs in January.
Read MoreNumber Of TV Channels Average Household Watches, 2008-2013 [CHART]
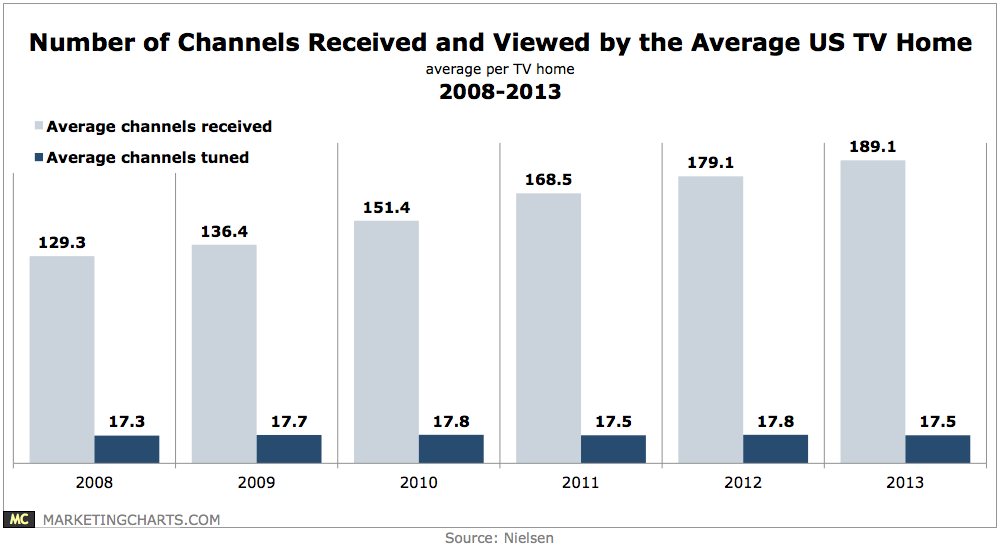
The number of channels watched by the average US TV home has remained between 17 and 18 each year since 2008, despite an ever-growing number of channels received by the average TV home.
Read MoreFactors That Would Encourage French TV Viewers To Use Video On-Demand, November 2013 [TABLE]
Lowering the price of available movies and series was the biggest factor that would encourage consumers to use VOD services more regularly (37.6% of respondents).
Read MoreHow Select Europeans Watch TV, February 2014 [TABLE]
Just 15% of internet users in France typically watched television via VOD.
Read MoreTV Subscriptions Of US Millennials vs Xers & Boomers, November 2013 [CHART]
The proliferation of digital video has raised the specter of large-scale cord-cutting by Millennials.
Read MoreTV Viewing Time By Programming, April 2014 [CHART]
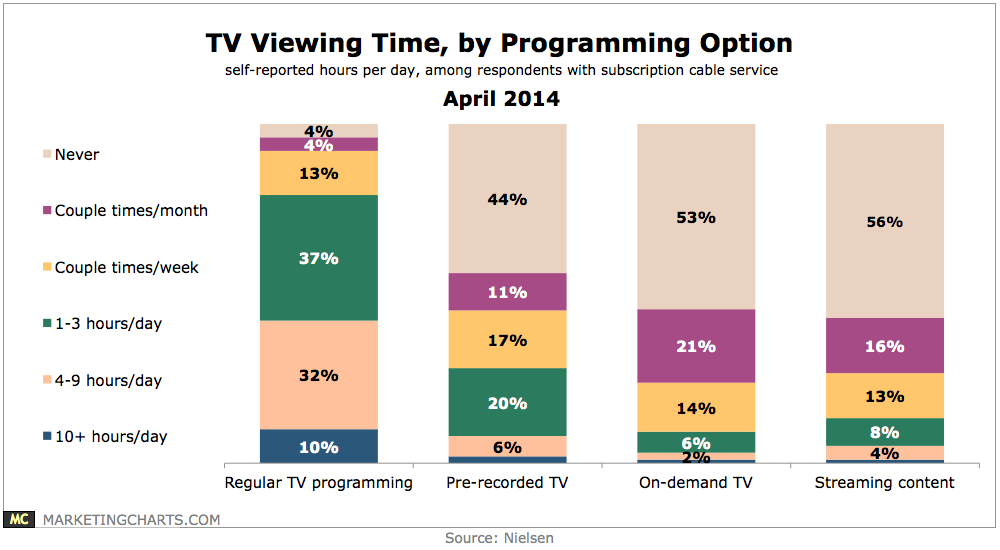
7 in 10 TV households in the US use at least one on-demand service, whether that be a DVR, a Netflix subscription, or video-on-demand from a cable or telco provider,
Read MoreGlobal Marketing Budget Sentiment By Medium, April 2014 [CHART]
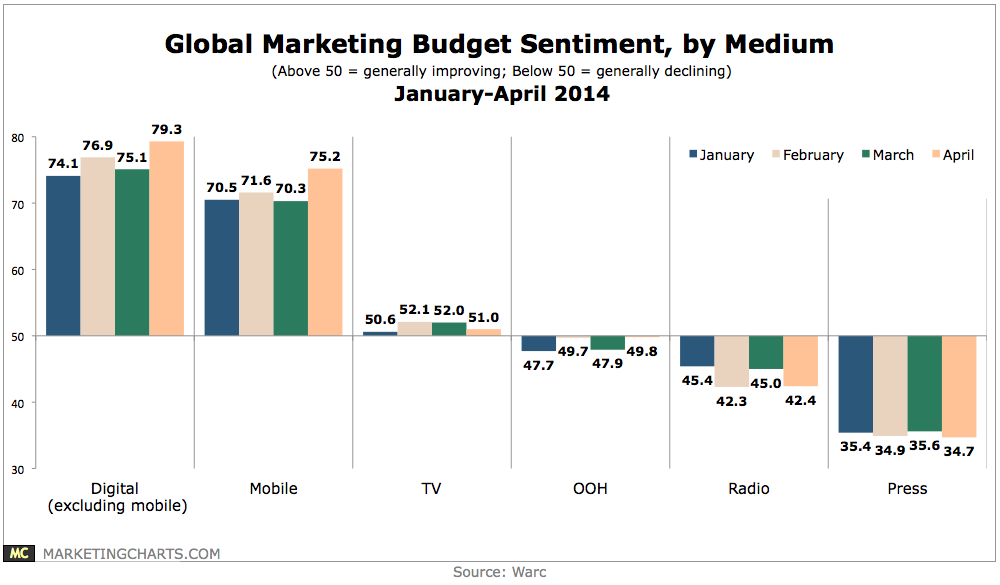
Not surprisingly, digital (excluding mobile) marketing budget expectations have been rapidly increasing throughout the first 4 months of the year, although it’s surprising to see them slightly exceed mobile budget optimism.
Read MoreAmericans Who Will Watch Mobile Ads In Exchange For Premium Content, Q1 2014 [CHART]
44.4% of US smartphone/tablet owners said they would happily or begrudgingly watch a mobile video ad for premium content.
Read MoreGrowth Of Average Daily Time Spent With Major Media, 2011-2014 [TABLE]
US advertisers are only expected to spend 10 cents per US adult per hour spent on digital media this year—and just 7 cents on mobile—compared with nearly $1 on print ads.
Read MoreAmericans' Daily Consumption Of Major Media, 2010-2014 [CHART]
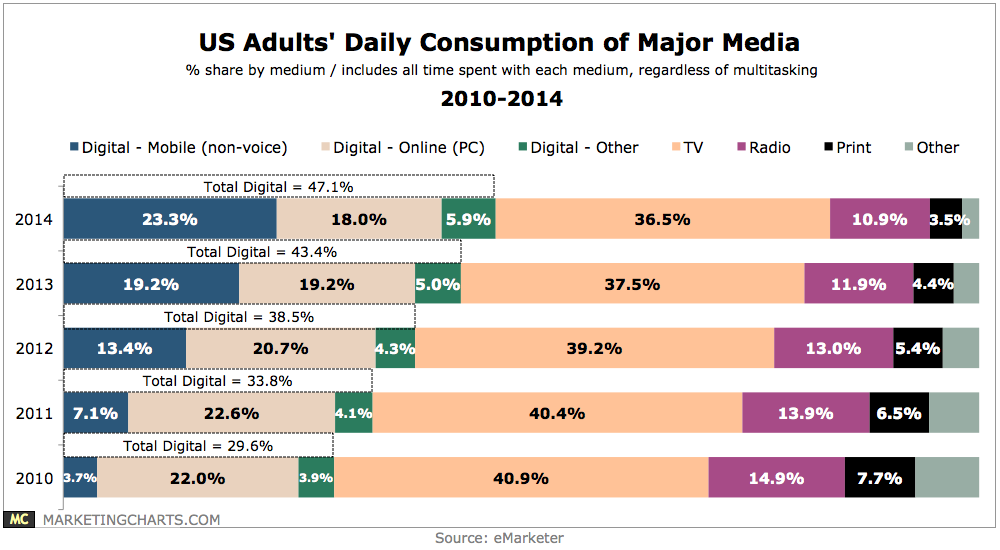
TV remains the single most-consumed medium, averaging 4 hours and 28 minutes per day, though that figure varies widely by age group.
Read More