Posts Tagged ‘Television’
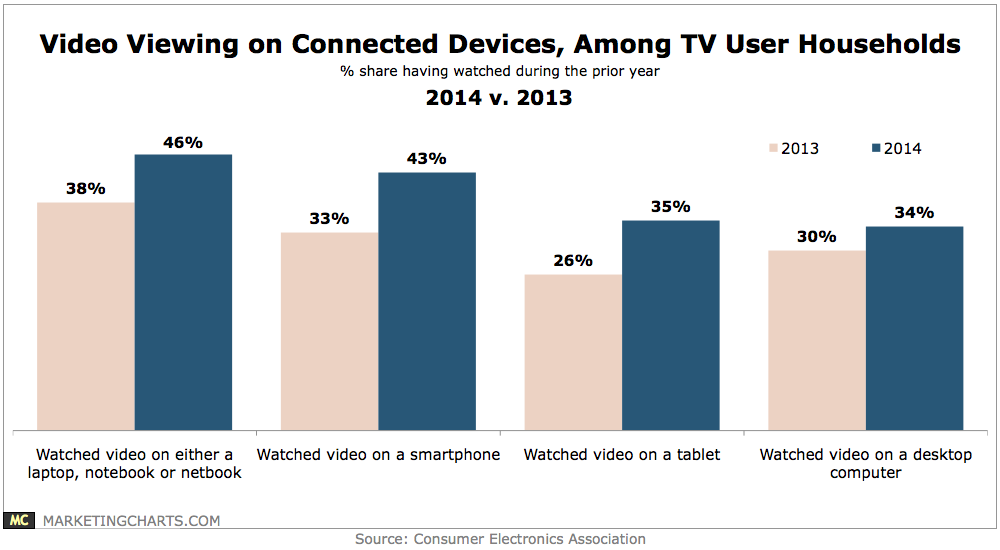
Video Viewing On Connected Devices, 2013 vs 2014 [CHART]
Almost half (46%) of TV user households watched video on a portable computer during the past year, with 43% watching video on a smartphone and 35% on a tablet.
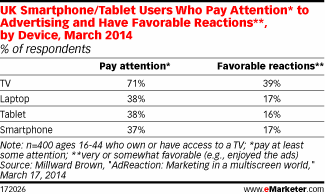
Read MoreUK Mobile Users Who Have Favorable Reactions To Advertising, March 2014 [TABLE]
eMarketer estimates that 80.6% of the entire UK population will be mobile phone users in 2014, while a further 41.1% will use tablets.
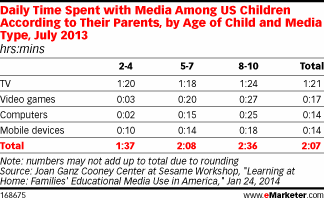
Read MoreGeneration V Media Consumption By Age & Channel, July 2013 [TABLE]
TV remains the biggest single element of Generation V’s media usage.
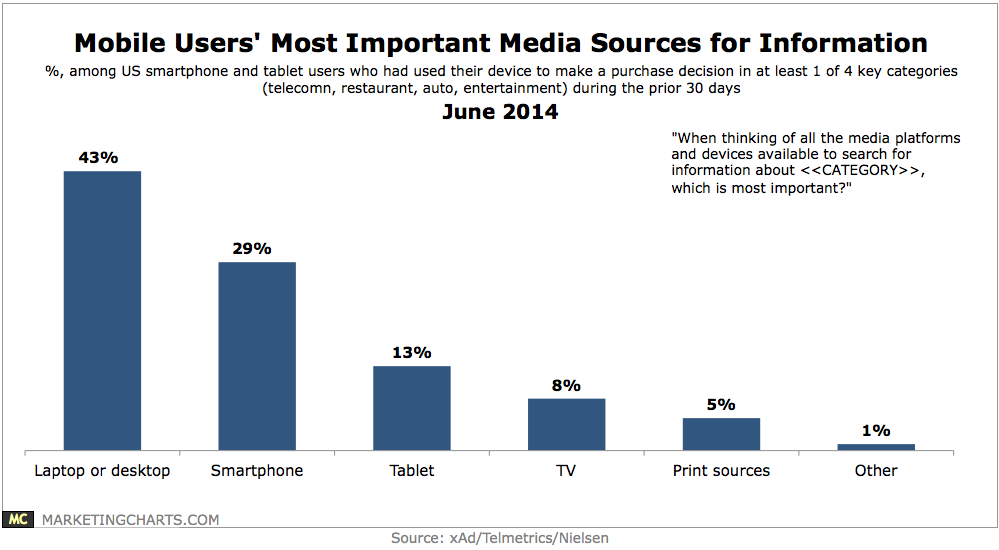
Read MoreMobile Users Most Important Devices For Information, June 2014 [CHART]
Some 29% named their smartphone the most important media platform when searching for information during the purchase process, up from 23% the prior year.
Read MoreDevices UK Millennials Will Use To Follow The World Cup, May 2014 [CHART]
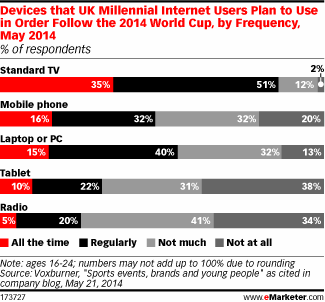
TV will be the medium of choice for UK consumers following the action, even among the most digitally connected and especially mobile millennial cohort.
Read MoreWorld Cup Fans' Online Behavior [INFOGRAPHIC]
This infographic by RadiumOne illustrates World Cup fans’ cross-device usage and social media sharing.
Read MoreAttitudes Toward TV Everywhere, May 2014 [TABLE]
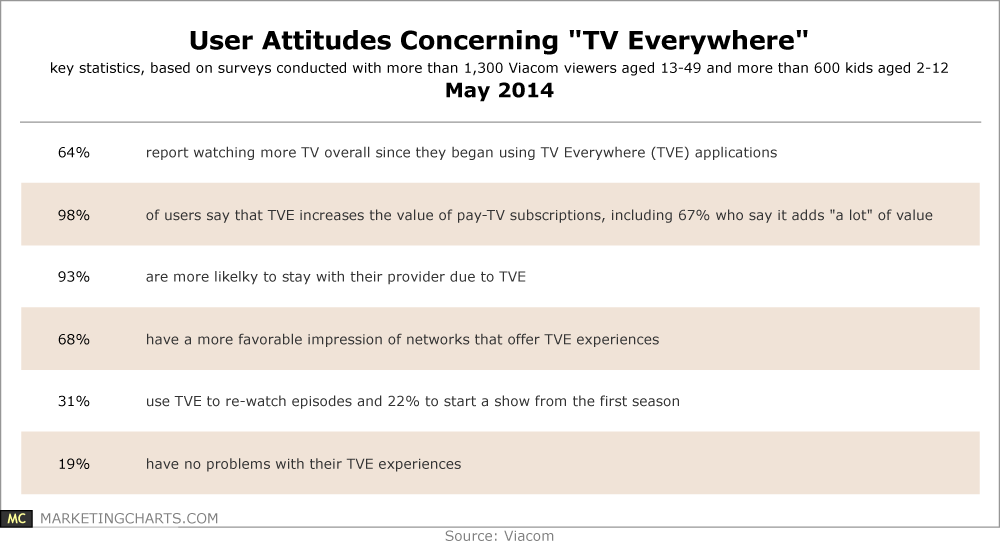
Almost two-thirds of respondents report watching more TV overall since they began using TVE applications.
Read MoreDaily Time Spent With Media Among Milllennial & Gen X UK Mothers, April 2014 [TABLE]
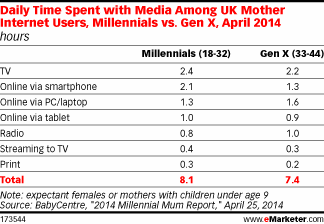
86% of UK millennial mother internet users owned a smartphone in 2014, while a further 70% owned a tablet.
Read MoreDevice Executives Most Use To Consumer News [CHART]
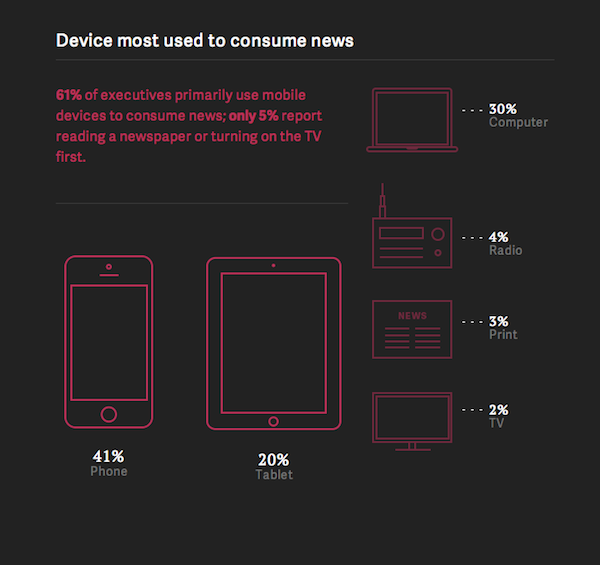
More than 50 percent of the survey responses by executives were completed on a mobile device.
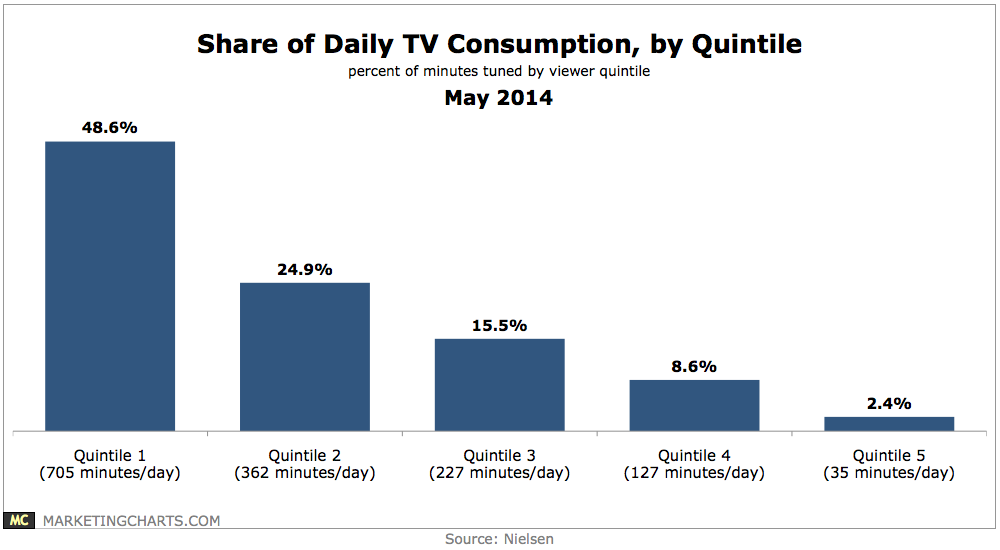
Read MoreShare Of Daily TV Consumption, May 2014 [CHART]
The top quintile of TV viewers (in terms of daily consumption of TV) watch an average of 705 minutes daily, or almost 12 hours of TV per day, with that figure up by almost one hour since 2009.
Read More