Posts Tagged ‘Telecommunications Marketing’
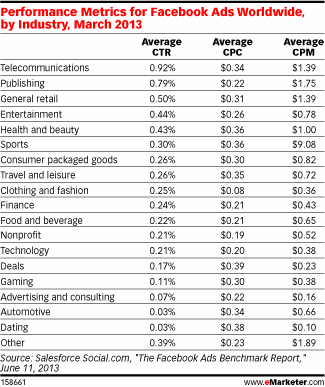
Global Facebook Advertising Performance Metrics By Industry, March 2013 [TABLE]
For overall Facebook ads served by industry, sports cost by far and away the most, at a CPM of $9.08.
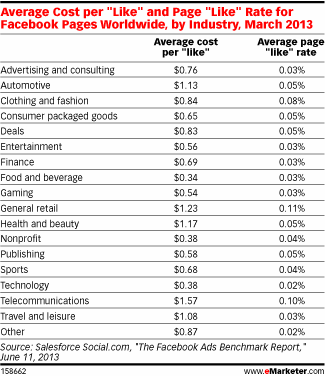
Read MoreGlobal Facebook Cost Per Like By Industry, March 2013 [TABLE]
General retail and telecommunications had the most success generating page “likes,” at a rate of 0.11% and 0.10%, respectively.
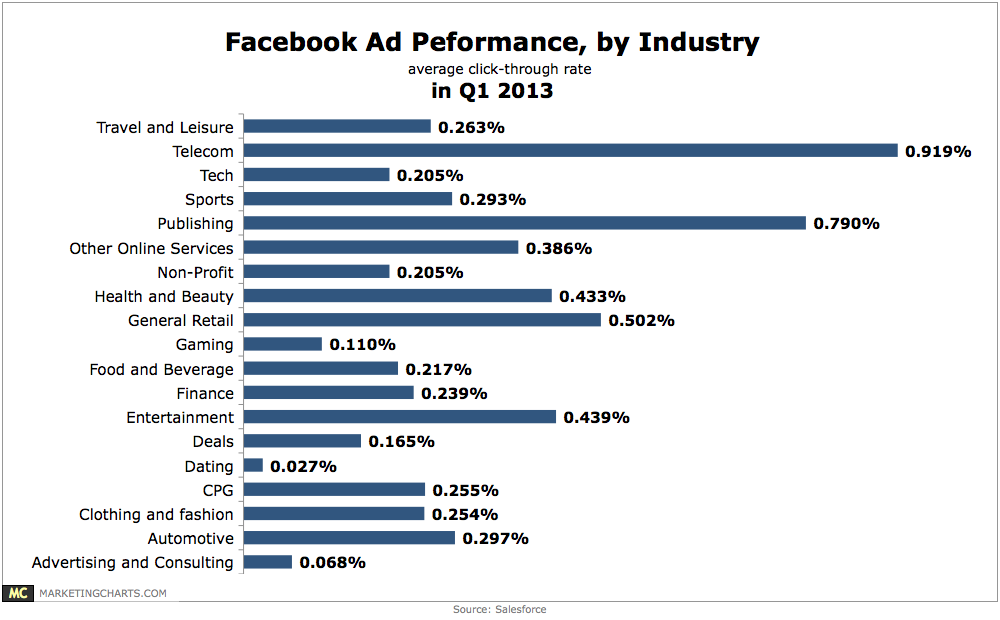
Read MoreFacebook Ad Performance By Industry, Q1 2013 [CHART]
Telecom (0.919%) and publishing (0.79%) brands are leading the charge in Facebook click-through rates.
Read MoreFacebook Ad Performance By Industry, Q1 2013 [CHART]
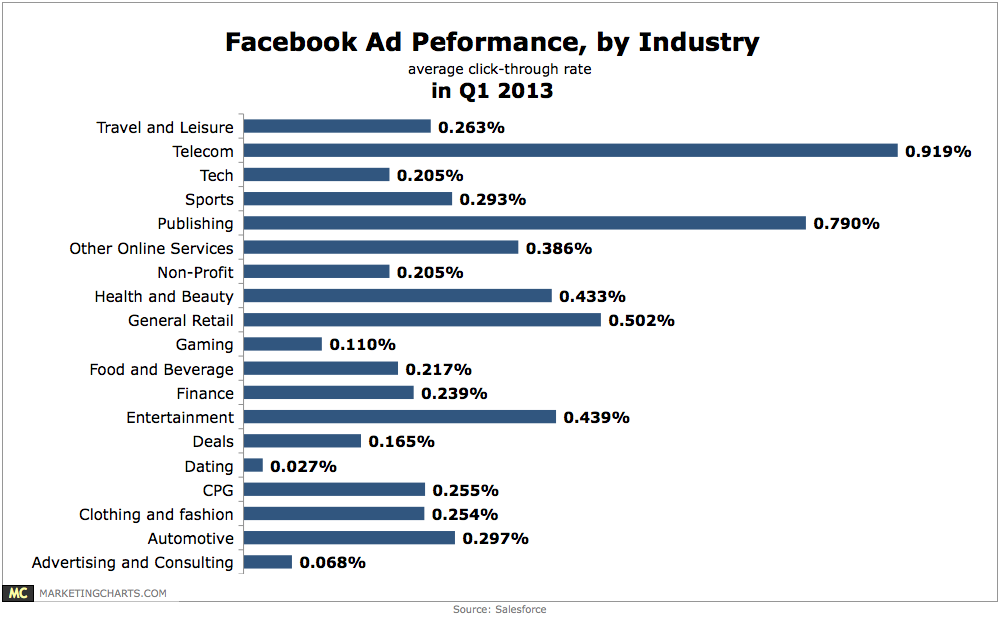
Telecom (0.919%) and publishing (0.79%) brands are leading the charge in click-through rates.
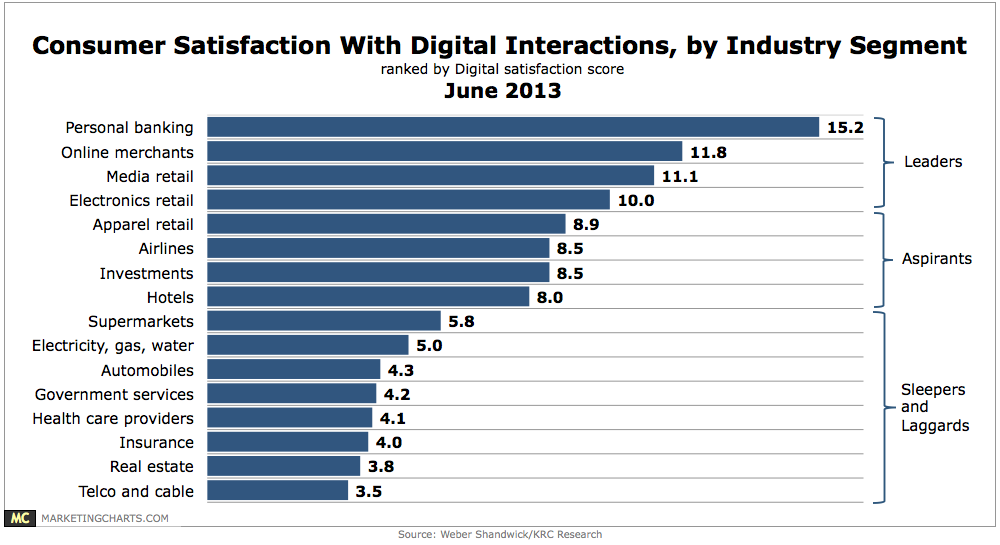
Read MoreCustomer Satisfaction With Online Interactions By Industry Segment, June 2013 [CHART]
E-commerce sites exceeded the threshold of excellence in customer satisfaction last year, according to the American Customer Satisfaction Index.
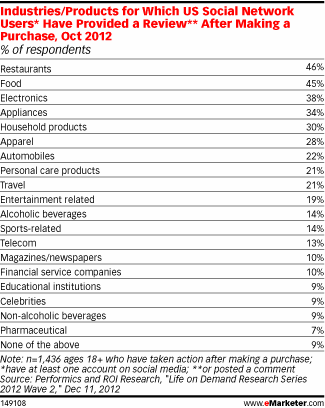
Read MoreIndustries & Products For Which People Have Written Post-Purchase Online Reviews, October 2012 [TABLE]
Among social network users who took a post-purchase action online, 22% reported posting a review or other comment after an automobile purchase.
Read MoreUS Location-Based Mobile Ads By Industry, 2012 [CHART]
100% of the studied mobile campaigns in the grocery, political, health care, lottery, real estate and education industries used location info of some sort.
Read More2013 Edelman Trust Barometer [PRESENTATION]
The 2013 Edelman Trust Barometer is the PR firm’s 13th annual trust and credibility survey of 26,000 ordinary people, ages 25-64 across 26 countries.
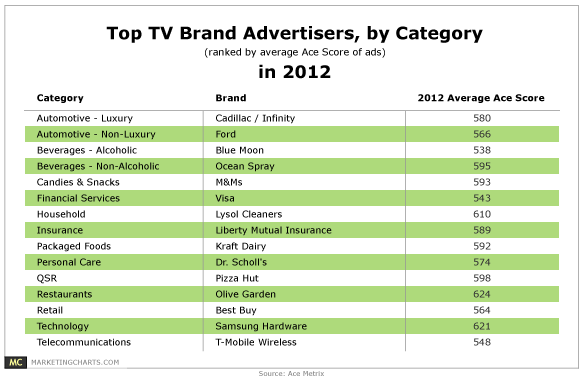
Read MoreTop 2012 TV Brand Advertisers By Category [TABLE]
2012 television brand advertising was marked by creative strategies that stressed innovation while embracing cause and humor.
Read MoreMost Popular Types Of Companies Followed On Social Networks [CHART]
Entertainment-related companies are the most popular to follow on social networks.
Read More