Posts Tagged ‘Technology Marketing’
Facebook Advertising Benchmarks [INFOGRAPHIC]
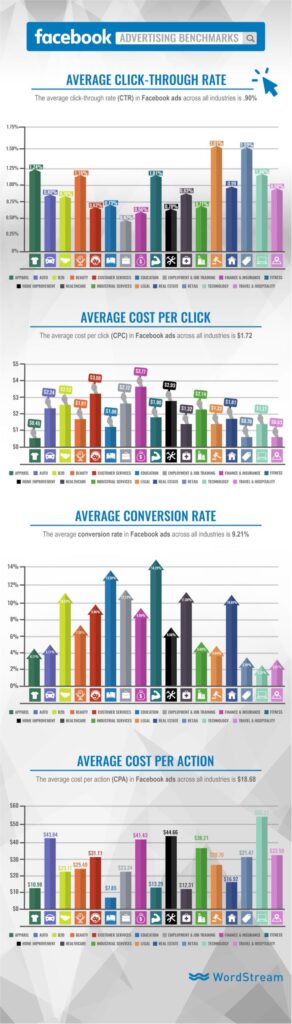
This infographic from WordStream illustrates the most important Facebook advertising benchmarks, including click-through rate, cost-per-click, conversion rate, and cost-per-action across 18 different industries.
Read MoreWhat Viewers Associate With Super Bowl Ads [CHART]
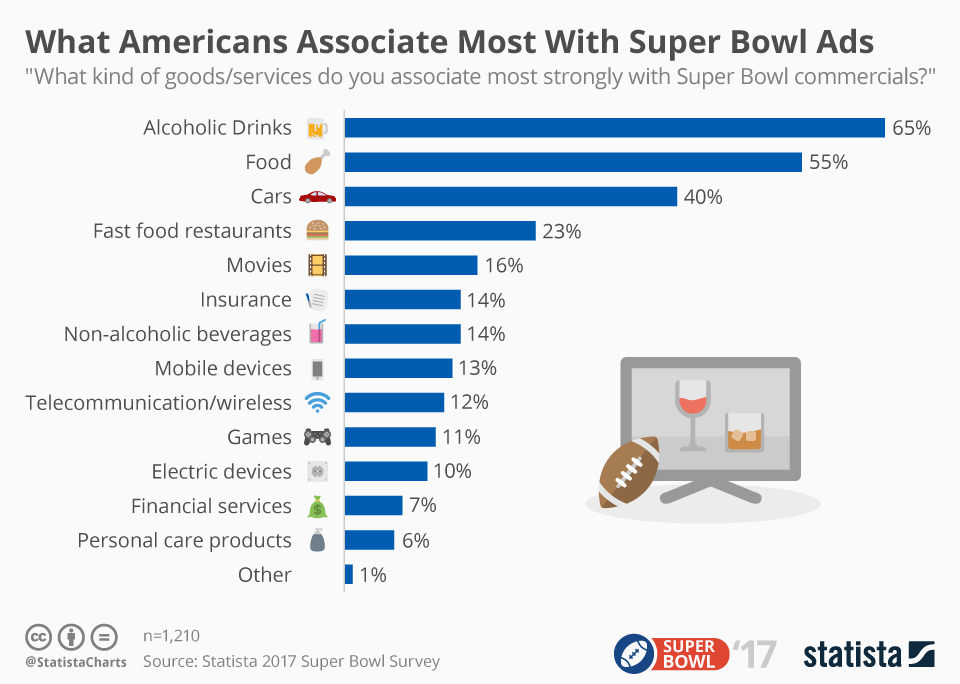
These days, 65 percent of Americans associate Super Bowl commercials with alcoholic beverages.
Read MoreInformation Sources For Making B2B Software Purchase Decisions [CHART]
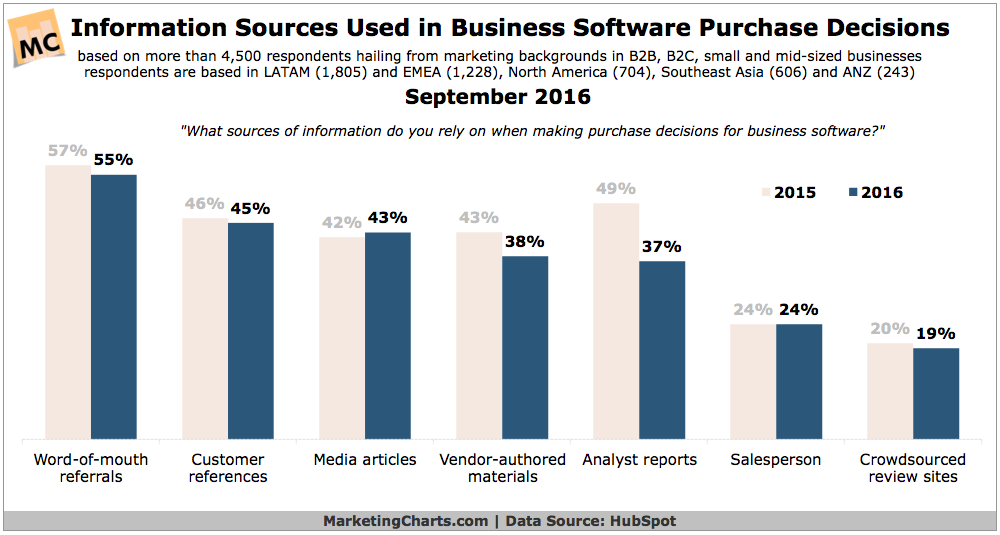
Word-of-mouth is a key purchase influencer for consumers, and it appears to also have a strong sway over purchase decisions for business software.
Read MoreB2B AdWords ROI For 6 Industries [CHART]
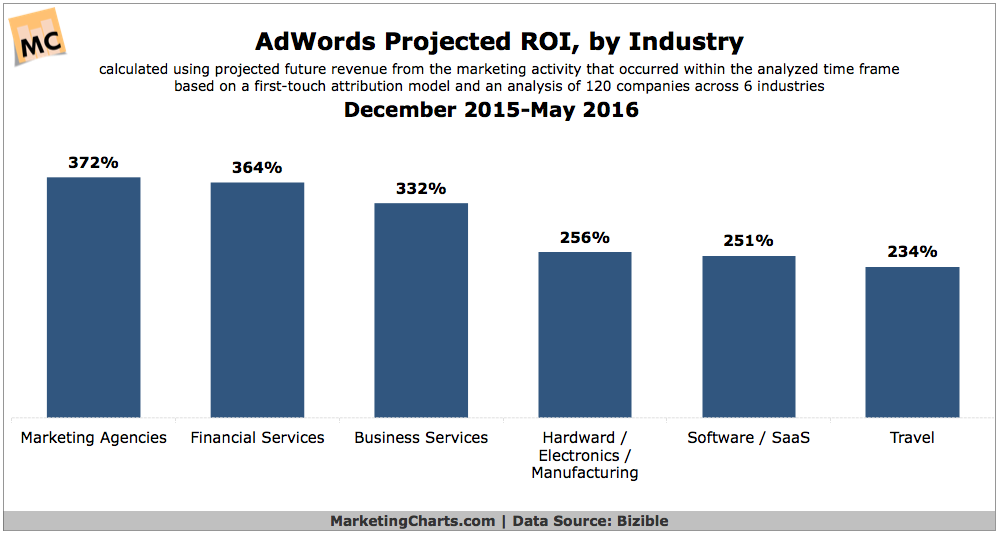
AdWords has the largest contribution to revenue (included projected revenue) for B2B financial services advertisers.
Read MoreEmail Reading, Glancing & Scanning By Industry [CHART]
![Email Reading, Glancing & Scanning by Industry [CHART]](https://e-strategy.com/wp-content/uploads/2016/11/Email-Reading-Glancing-Scanning-By-Industry.png)
A majority (53%) of emails are read, meaning that the recipient (presumably) looks at the message for at least 8 seconds.
Read MoreGoogle AdWords Benchmark Metrics By Industry [CHART]
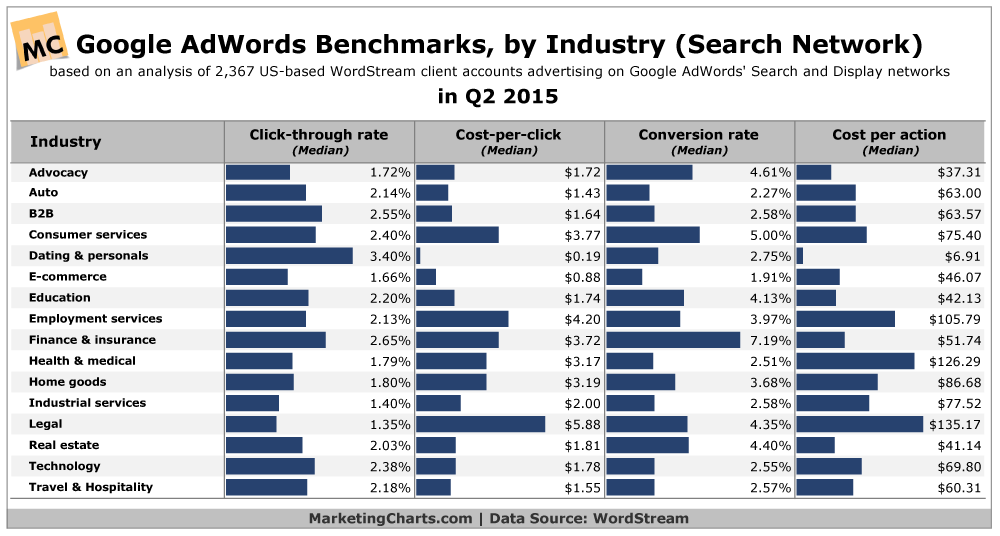
The median click-through rate (CTR) in AdWords across industries is 1.91% on the search network.
Read MoreAmericans' Positive Attitudes Toward Select Institutions [CHART]
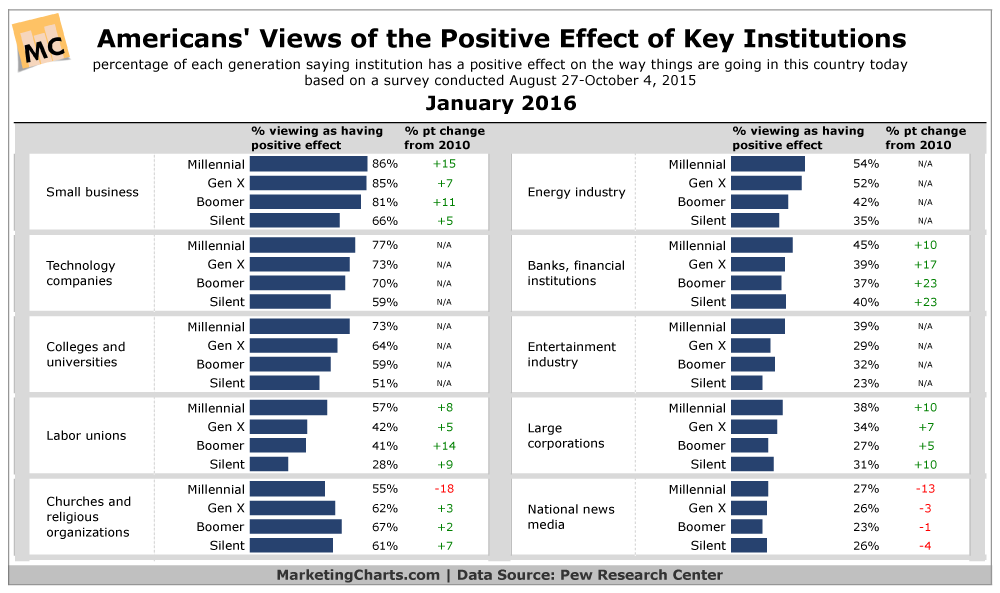
In some cases, there are marked variations in the views that American generations have of key institutions in the US.
Read MoreInternet Of Things Spending By Industry [TABLE]
The travel and hospitality industry leads spending on the Internet of Things technology.
Read MoreTypes Of News For Which Mobile Users Prefer A Browser vs An App, August 2015 [CHART]
For some activities, mobile users have a clear preference about app vs. browser usage.
Read MoreGlobal Email Deliverability Rates By Industry, October 2015 [CHART]
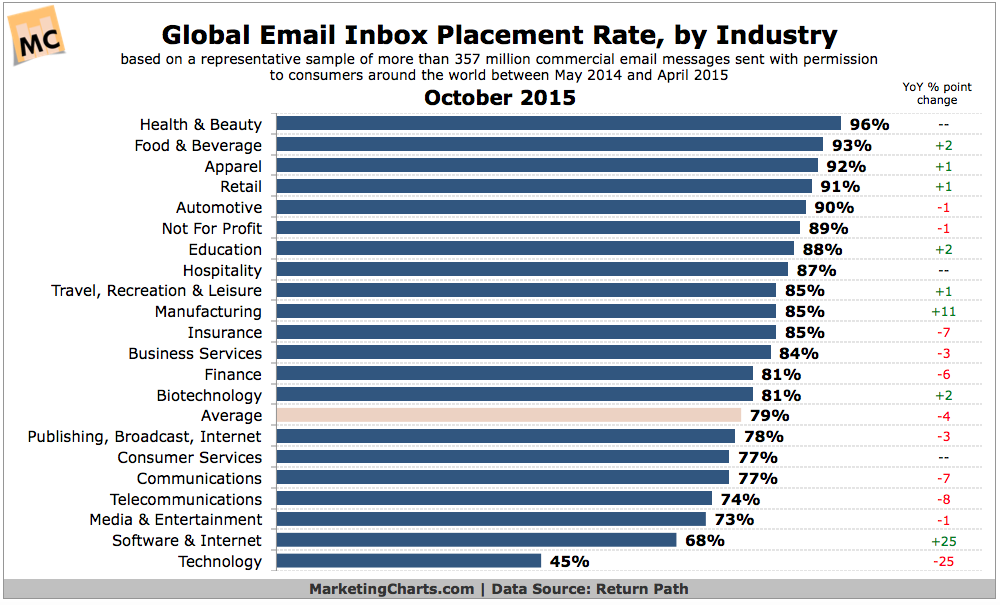
Some 21% of permission emails from legitimate senders around the world failed to reach the inbox during the year-long period from May 2014 to April 2015.
Read More