Posts Tagged ‘Tablets’
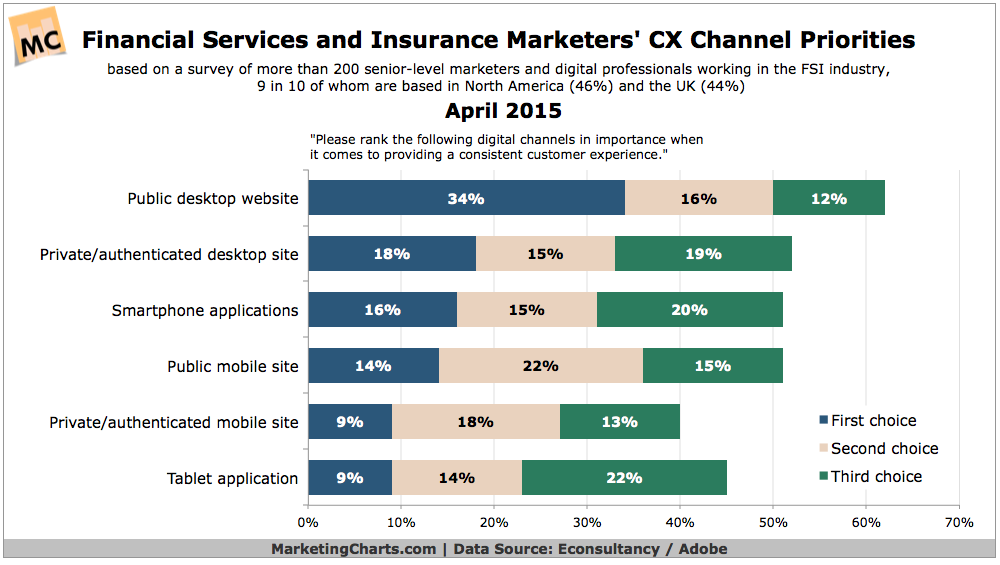
Financial Services Customer Experience Channel Priorities, April 2015 [CHART]
Public desktop websites are a greater priority than smartphone apps or public mobile sites when it comes to providing a consistent customer experience.
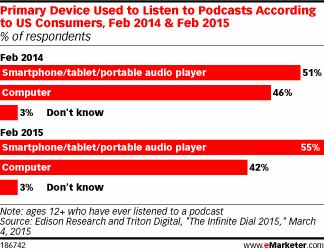
Read MorePrimary Podcast Listening Device, 2014 vs 2015 [CHART]
Fully 55% of US consumers ages 12 and older who had ever listened to a podcast said they used a smartphone, tablet or portable audio player most frequently to do so.
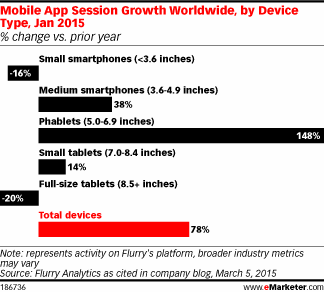
Read MoreGrowth In Mobile App Sessions By Device Type, January 2015 [CHART]
Global mobile app sessions on phablets rose nearly 150% year over year in January.
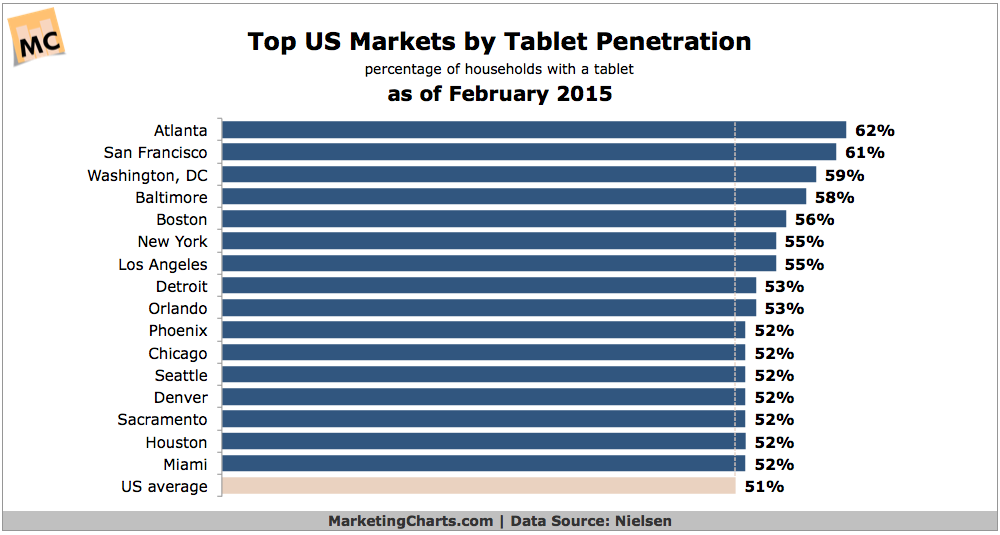
Read MoreTop US Markets By Tablet Penetration [CHART]
Tablet penetration has reached 51% of US households as of February, up 13% points year-over-year.
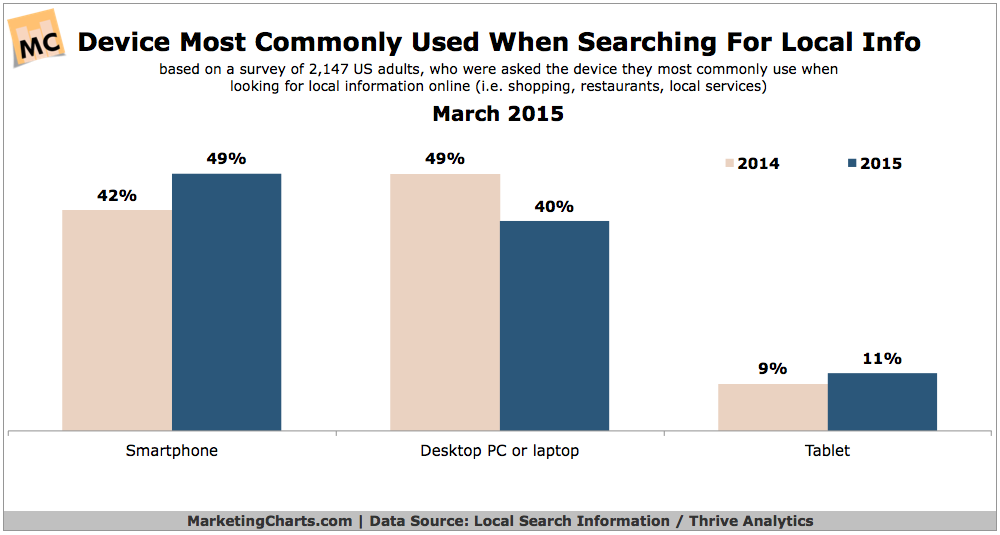
Read MoreDevices People Use To Search For Local Info, March 2015 [CHART]
Some 49% of US adults point to their smartphone as the device they most commonly use when looking for local information online.
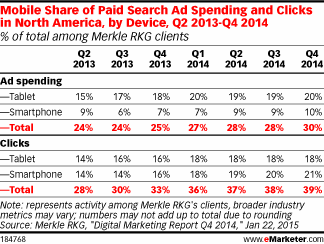
Read MoreMobile Share Of Search Ad Spending & Clicks, 2013-2014 [TABLE]
Mobile increased its share of paid search clicks by 6 percentage points in North America between Q4 2013 and Q4 2014, from one-third to nearly 40%.
Read MoreMobile Website Visits by Industry, 2014 [CHART]
Smartphone and tablet visit shares are up in each of 6 industries analyzed by Adobe.
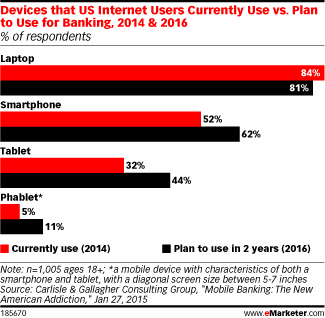
Read MoreDevices People Currently Use & Plan To Use For Banking, 2014 & 2016 [CHART]
Mobile banking ranked as the third most-used bank feature among respondents, at 45%.
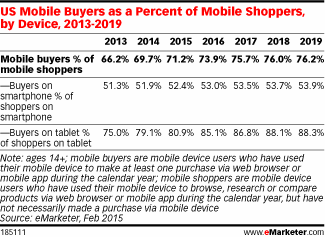
Read MoreMobile Buyers As A Percent Of Mobile Shopper, 2013-2019 [TABLE]
eMarketer estimates that more than 150 million people used a mobile device to research, browse or compare products last year.
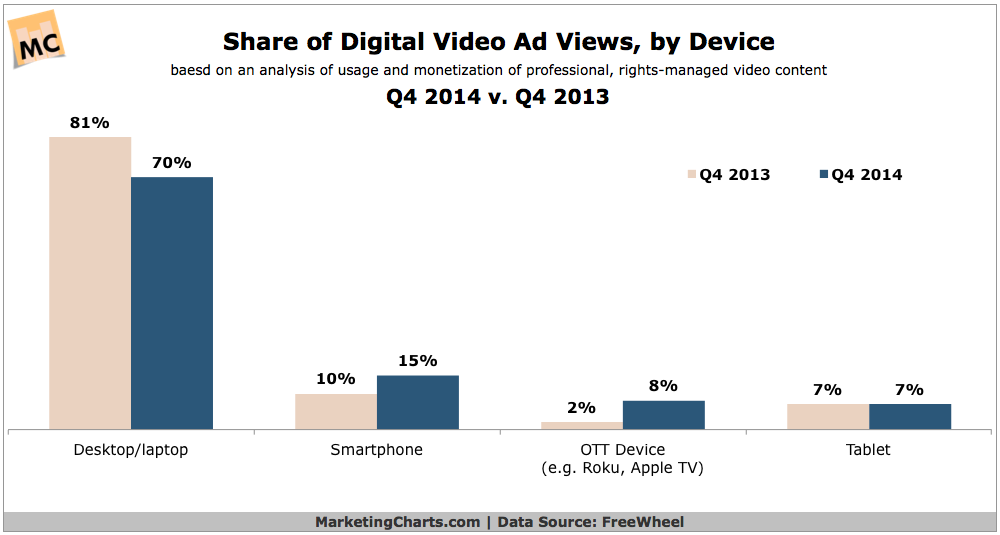
Read MoreShare Of Video Ad Views By Device, 2013 vs 2014 [CHART]
Tablets are popular devices for video viewing but OTT streaming devices such as Apple TV and Chromecast have moved ahead in digital video monetization.
Read More