Posts Tagged ‘Tablets’
Consumer Reactions To Unoptimized Mobile Email, March 2013 [CHART]
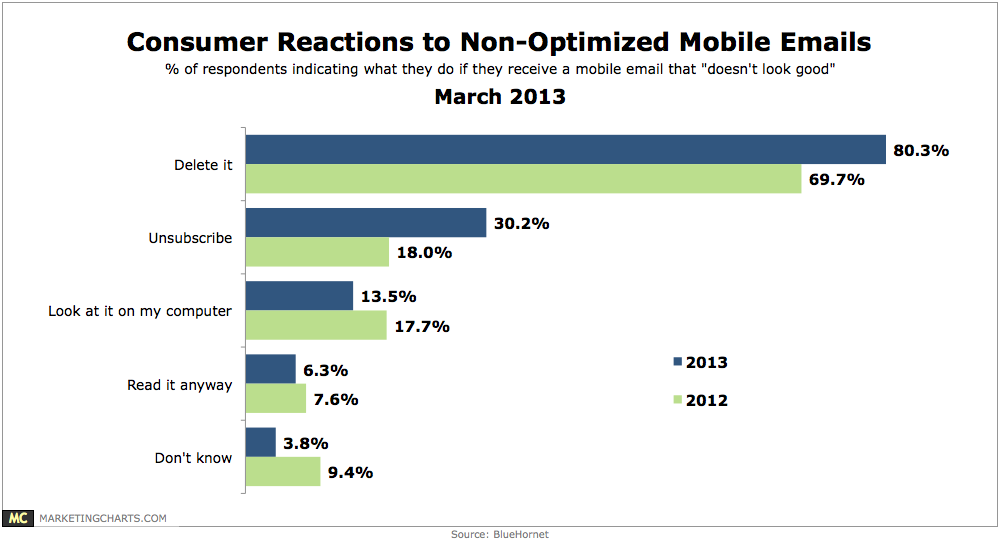
43% of consumers say they read emails most often on a smart phone (36.4%) or tablet (6.9%) as opposed to a desktop or laptop computer.
Read MoreZero-TV Homes, March 2013 [TABLE]
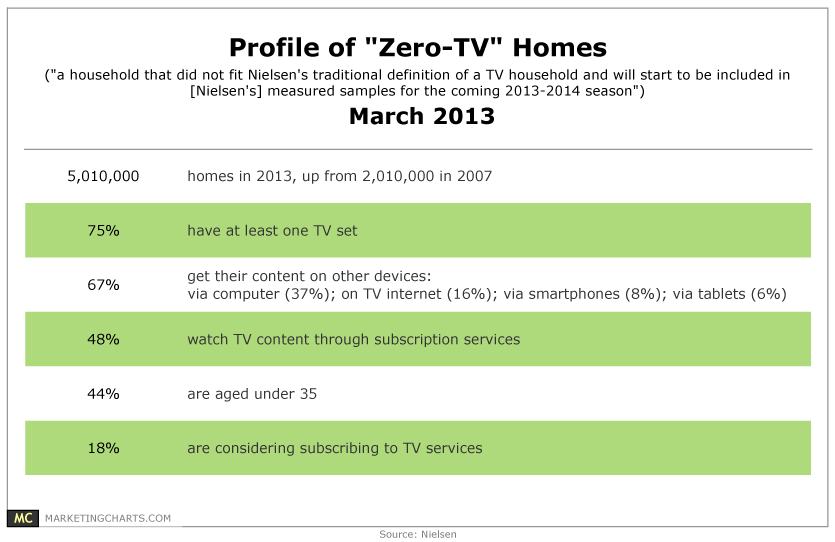
The number of Zero-TV households has more than doubled from 2007 to exceed 5 million.
Read MoreActivities Performed On Computers vs. Tablets vs. Smart Phones [CHART]
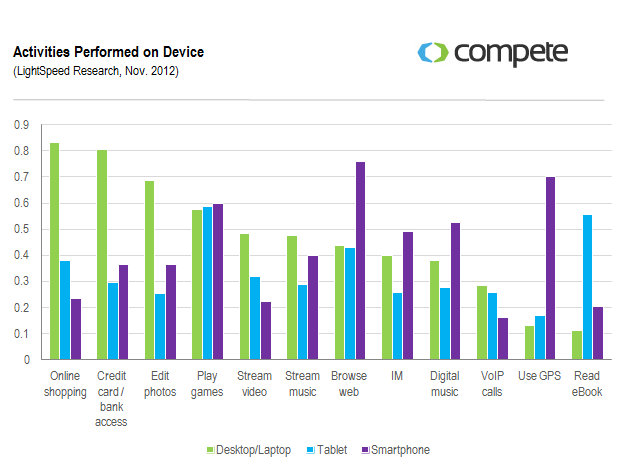
45% of consumers who use their mobile devices to shop report using the device to compare prices.
Read MoreConsumer Electronics Devices Owned & Used Regularly, November 2012 [CHART]
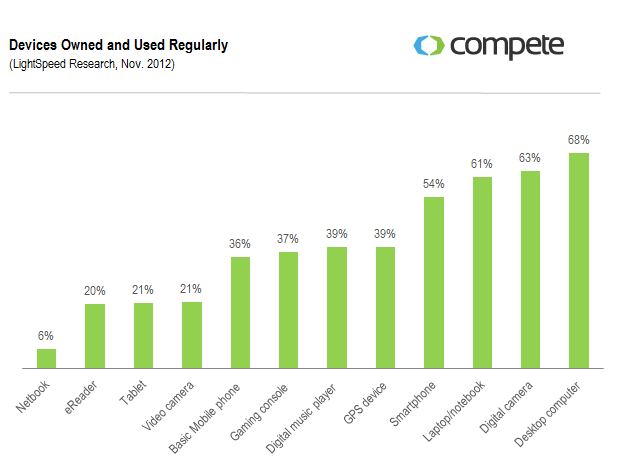
54% of consumers report having access to a smartphone with Internet access – approaching the number of consumers with a laptop and/or desktop computer.
Read MoreConsumer Behavior & Mobile Marketing [INFOGRAPHIC]
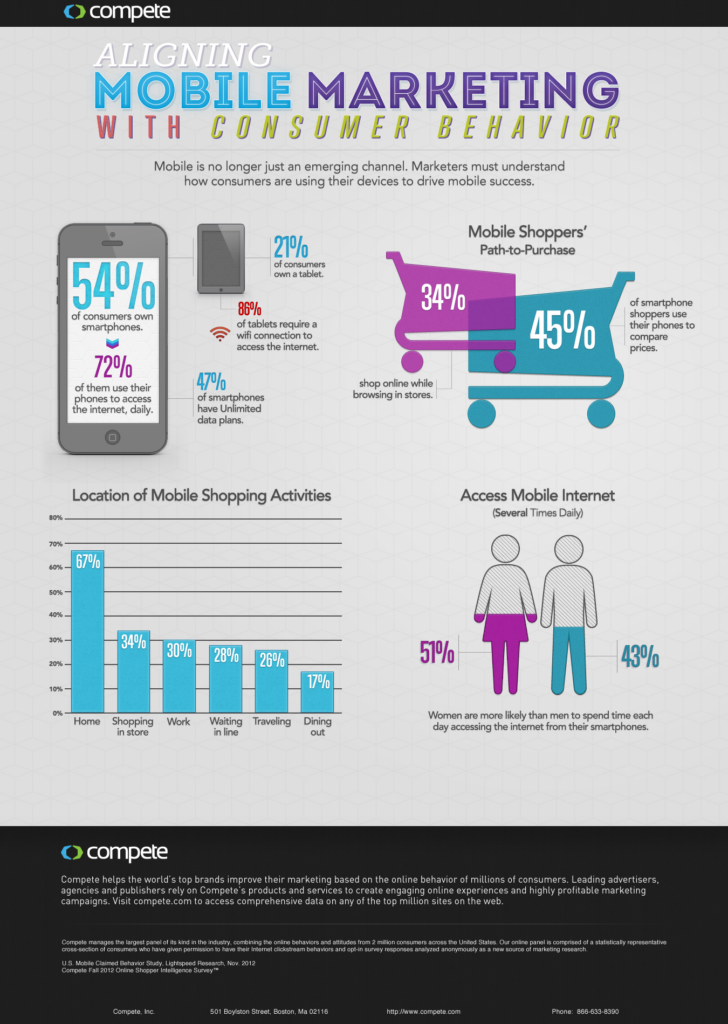
This infographic from LightSpeed Research suggests that mobile should no longer be thought of as an emerging channel for consumers.
Read MoreConsumer Reactions To Multi-Screen Advertising, March 2013 [CHART]
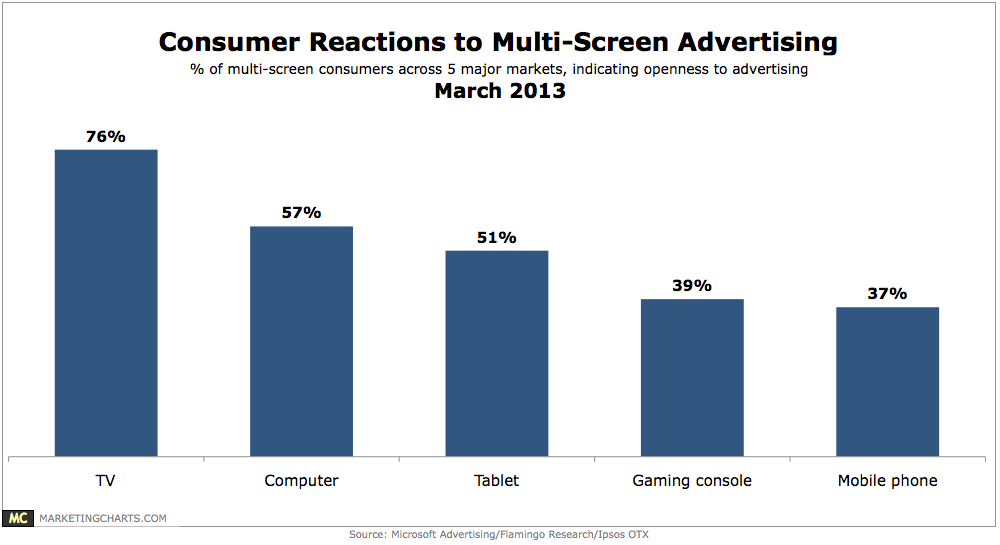
Almost three-quarters of multi-screen consumers across 5 major markets agree that advertising can be helpful in telling them about new products or brands that might interest them.
Read MoreTypes Of Streamed Mobile Video By Device, January 2013 [CHART]
The top three kinds of content for both smart phone & tablet users were movies, user-generated content (such as YouTube videos) and TV shows.
Read MorePercentage Of Mobile Shopping By Moms, December 2012 [CHART]
Fully 70% of moms reported using their smart phone or tablet to shop.
Read MoreMobile Web Traffic By Device & Country, February 2013 [CHART]
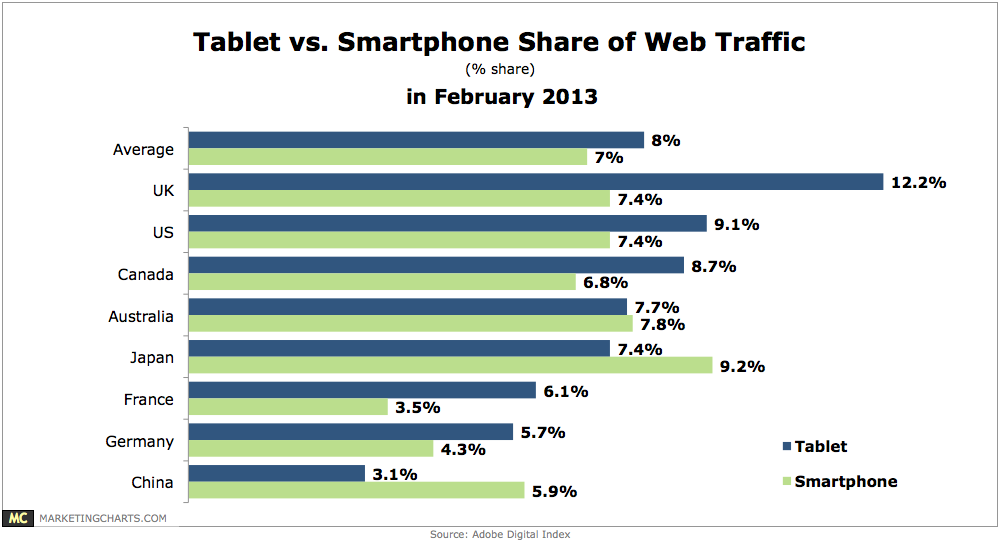
For the first time, tablet traffic exceeded smart phone traffic in February 2013 (8% and 7% of page views, respectively).
Read MoreFrequency Of College Students' Mobile Purchases, November 2012 [CHART]
70% of college students made mobile purchases, and 52% did so at least once a month.
Read More