Posts Tagged ‘Streaming Video’
Weekly American Netflix Streamers, 2010 & 2013 [CHART]
In 2013, according to Leichtman, 22% of US consumers surveyed said they streamed Netflix weekly—more than five times as many as watched content via Netflix in 2010.
Read MoreAmericans' TV & Video Media Consumption By Generation, Q2 2012 [TABLE]
In Q2 2012, the average US mobile subscriber spent 5 hours and 20 minutes per month watching video on a mobile phone.
Read MoreWhy People Stream Online Video By Content Type, May 2013 [TABLE]
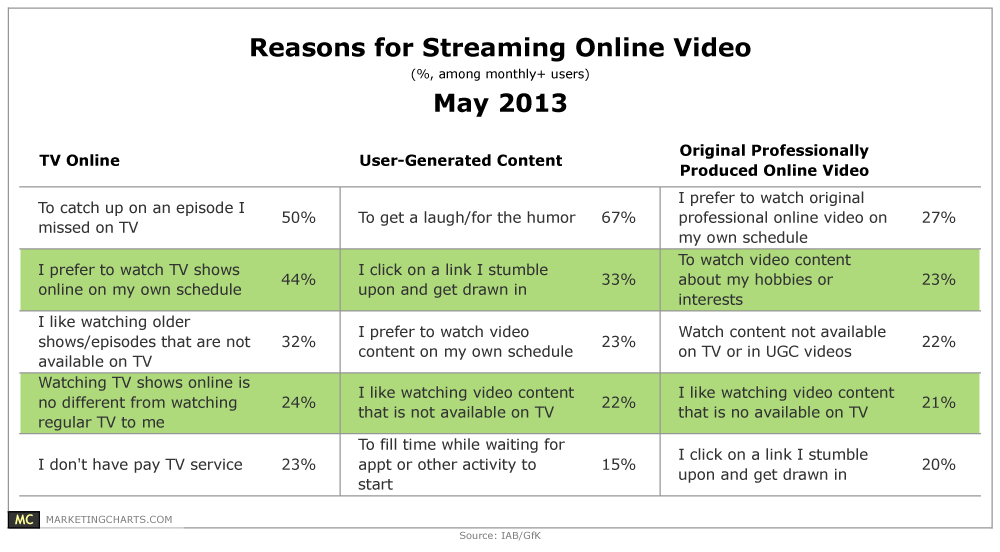
Among monthly users, network TV shows online have the same “wantedness” score as sports on regular TV, and also rivals regular primetime TV, meaning that these viewers attach a similar importance to online and regular TV content.
Read MoreNetwork TV Streaming & Pay TV, 2011 vs 2012 [CHART]
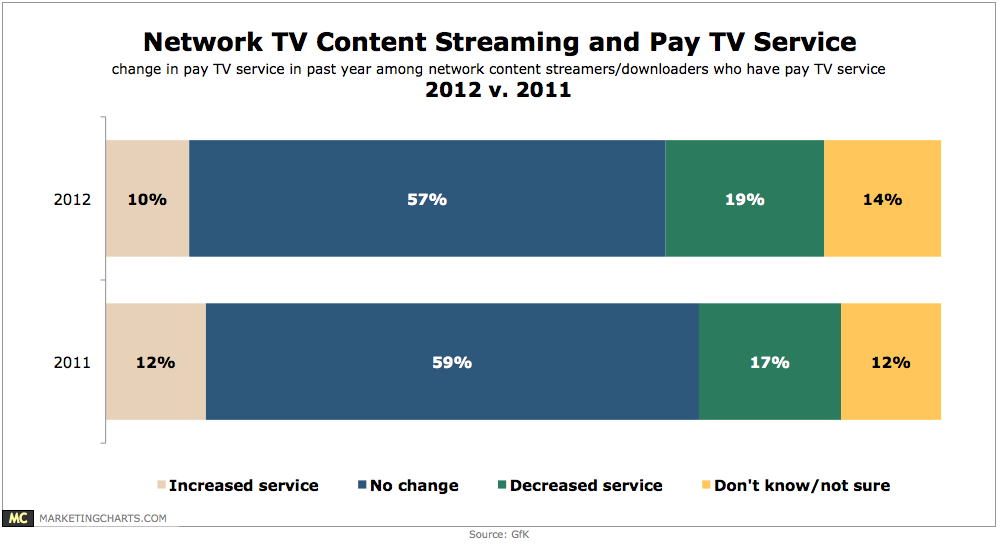
19% of TV video streamers and downloaders in 2012 reported decreasing service (“cord-slicing”) in the past year.
Read MoreHow People Binge On TV, February 2013 [CHART]

Most US TV viewers (63%) had used an online subscription service (like Netflix) to binge-view TV.
Read MoreBinge TV Viewing Behavior By Demographic, February 2013 [TABLE]
62% of people watched multiple episodes of a TV show in succession, also known as “binge-viewing.”
Read MoreHow People Watch Time-Shifted TV By Demographic, February 2013 [TABLE]
Nearly eight out of 10 US adult internet users watched TV on their own schedule.
Read MoreEffect Of Streaming Video On Traditional TV Consumption, 2006-2012 [CHART]
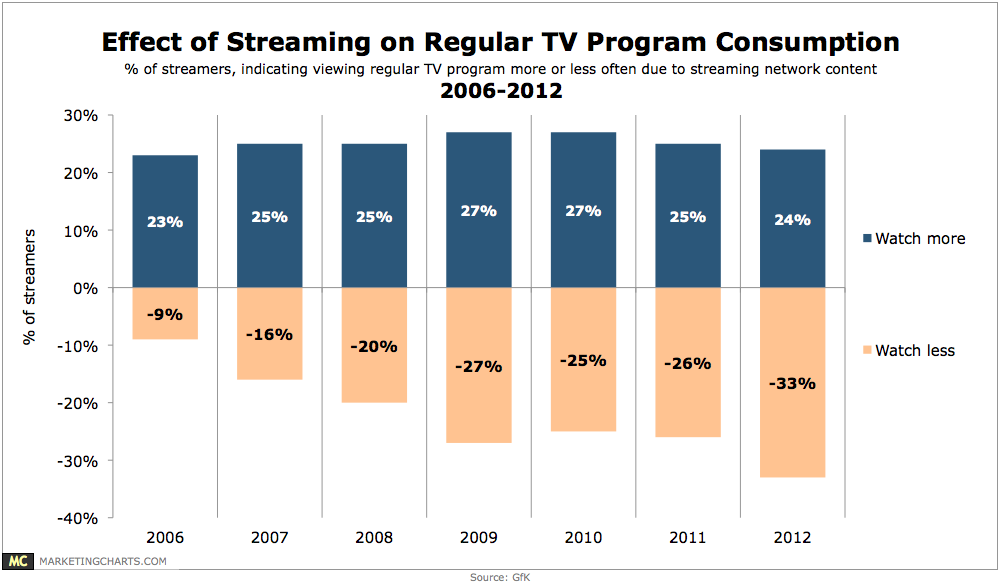
34% of US internet users (and 30% of all consumers aged 13-54) surveyed in December 2012 reported having watched streaming video content that originated from a network since the beginning of September.
Read MoreOnline Viewership For Broadcast TV, March 2013 [TABLE]
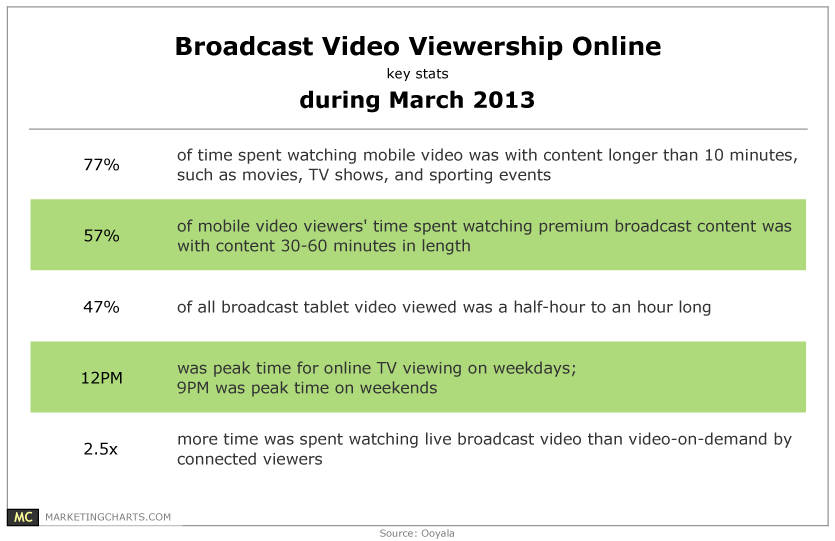
Connected viewers watched live broadcast video 2.5 times longer than video on demand (VOD), while 77% of time spent watching mobile video was with content longer than 10 minutes, such as movies, sporting events, and TV shows.
Read MoreMobile Device Use By Activity & Device Size, February 2013 [CHART]
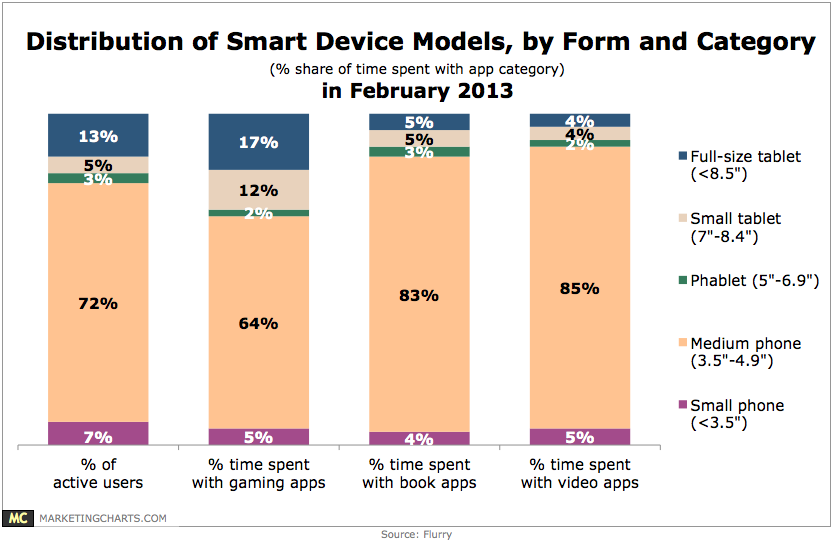
While small (5%) and full-size (13%) tablets accounted for less than 20% of active smart device users around the world, they represented 29% of time spent playing gaming applications on such devices in February 2013.
Read More