Posts Tagged ‘Smart Phones’
Time Spent Watching Long Online Videos By Device, Q4 2012 [CHART]
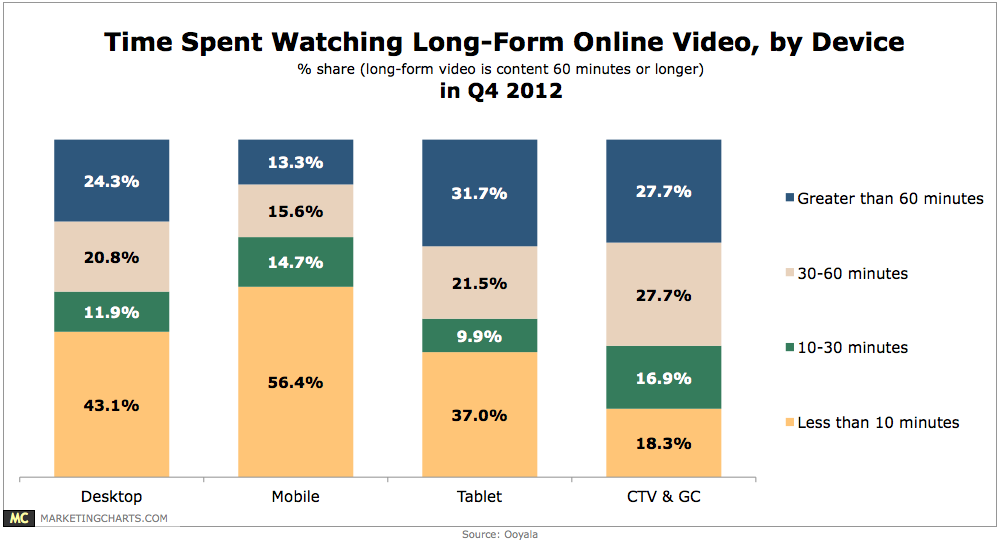
In Q4 2012, 53.2% of time spent watching tablet video was with content running at least a half-hour in length.
Read MoreCost per Loyal Mobile App User Index, June 2012 – January 2013 [CHART]
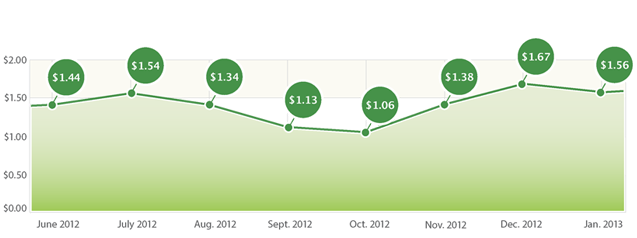
The Cost per Loyal Mobile App User Index measures the cost of acquiring a loyal user for brands who proactively market their apps.
Read MoreApp Store Competitive Index, June 2012 – January 2013 [CHART]
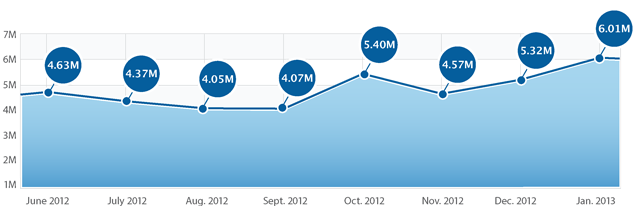
The App Store Competitive Index continued to climb by 6.01 million daily downloads, up 13 percent from December’s 5.32 million.
Read MoreMobile Enterprise [INFOGRAPHIC]
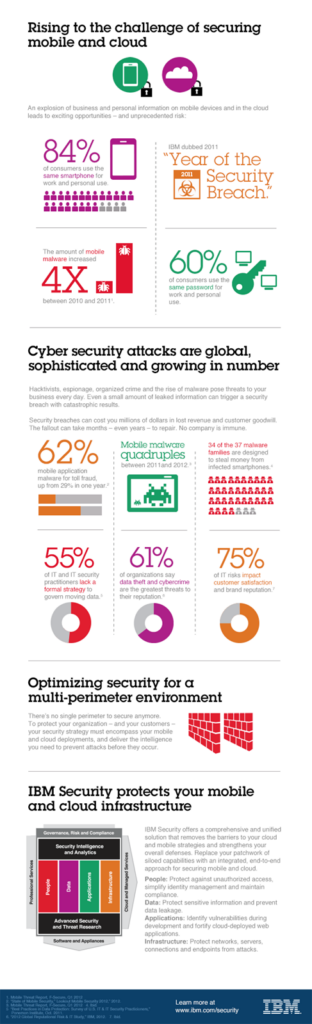
While 84% of consumers now use their personal smart phones for work, mobile malware has increased more than four times since 2010.
Read MoreHoliday Multi-Screen Shopping, 2012 [TABLE]

63% of shoppers used multiple devices to help with their holiday purchases last year.
Read MoreVideo Buffering Problems By Device, 2012 [CHART]
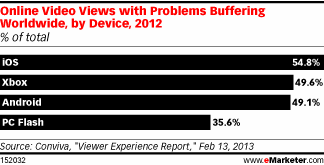
Almost 55% of online video views on iOS devices had a problem with buffering, compared to 50% of video views on Xbox, 49% on Android, and only 36% on PCs using Flash.
Read MoreSearch Advertising Cost Per Click By Device, Q4 2011 – Q4 2012 [TABLE]
US advertisers will increase mobile search ad spending 80.6% this year to $3.54 billion, up from $1.99 billion in 2012.
Read MoreSearch Ad Spending Share By Device & Search Engine, Q4 2011 – Q4 2012 [TABLE]

On desktops, Google captured more than four-fifths of search spending in the last quarter measured.
Read MoreSearch Advertising Click Share By Device, Q4 2011 – Q4 2012 [CHART]
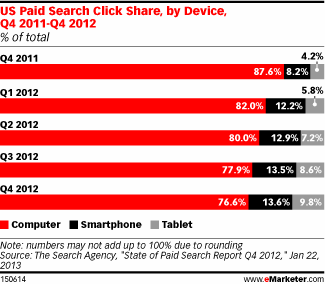
The share of paid clicks coming from smart phone and tablet devices nearly doubled between Q4 2011 and Q4 2012.
Read MoreTop New Developments Affecting Email Marketing, February 2013 [CHART]
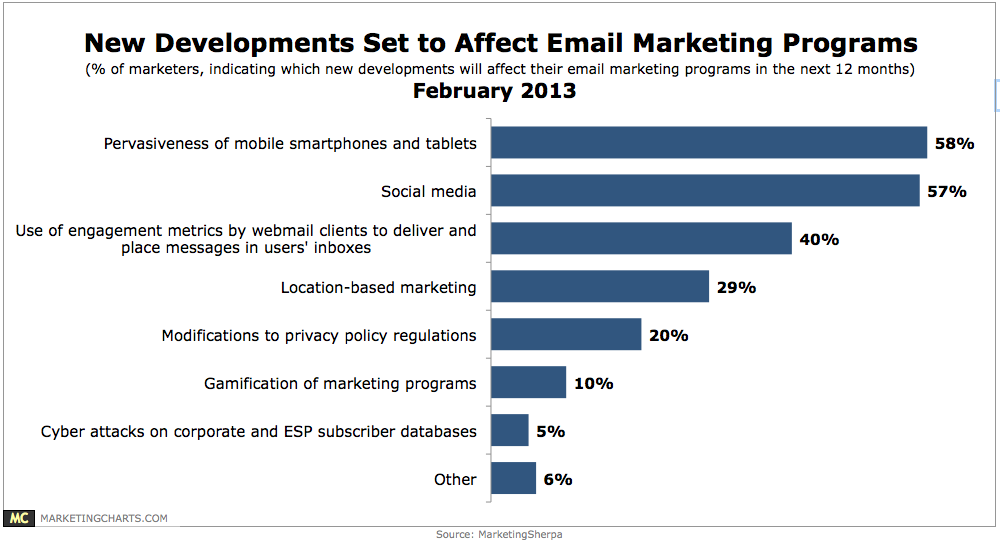
Asked what new developments will affect their email marketing programs in the next 12 months, 58% of marketers cited the pervasiveness of smartphones and tablets, and 57% pointed to social media.
Read More