Posts Tagged ‘Smart Phones’
Daily Mobile Activities, February 2014 [CHART]
Smart phone owners spend a whopping 3.3 hours per day on their phones, while tablet owners are close behind, averaging 3.1 hours a day on their devices.
Read MoreMultitainment Devices, November 2013 [CHART]
Three-quarters of US TV viewers were more focused on what was on the tube, even when using a second screen.
Read MoreThe Evolution Of News & Social Media [INFOGRAPHIC]
This infographic by the University of Florida Online tracks the parallel evolution of major news and social media outlets.
Read MoreeCommerce Site Visit Share By Device, Q4 2012-Q4 2013 [CHART]
When it comes to mobile commerce, there continues to be one dominant player: the iPad.
Read More7 Types Of American Smart Phone Users [TABLE]
Experian Marketing Services has released a report segmenting US smartphone owners into 7 groups.
Read MoreMonthly Time Spent On Social Networks, July 2013 [TABLE]
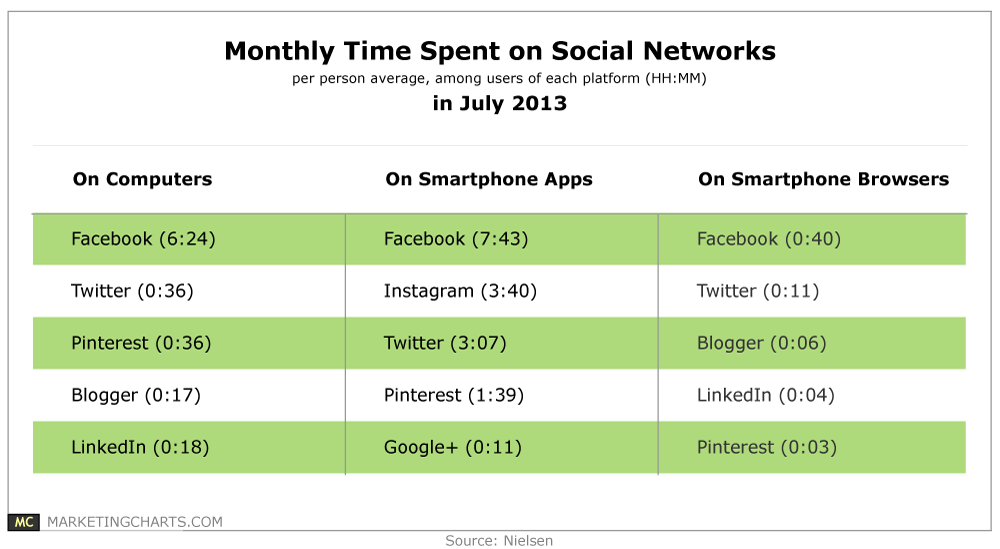
Among smartphone app users in July 2013, Instagram users were spending more time per person per month on the platform (3 hours and 40 minutes) than Twitter users (3 hours and 7 minutes).
Read MoreGlobal Traveler, 2014 [INFOGRAPHIC]
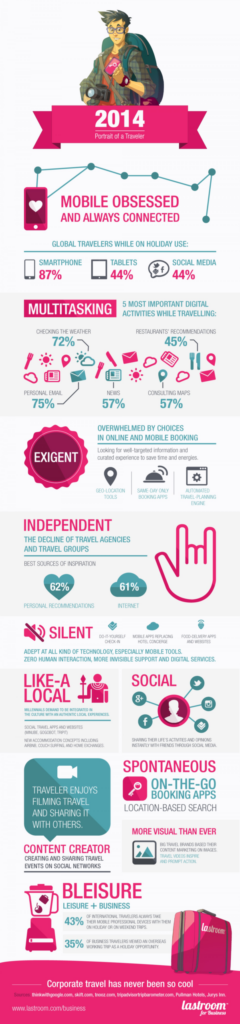
This infographic from LastRoom paints a picture of the behavior of the global traveler of 2014.
Read MoreEmail-Driven Orders By Device, Q4 2013 [CHART]
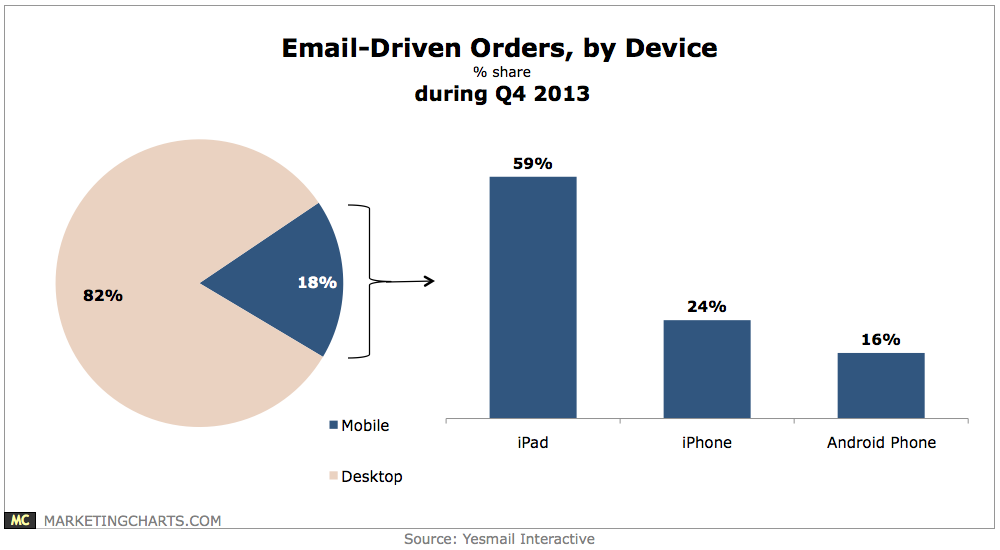
Some 18% of email-driven orders were completed on a mobile device during Q4 2013, up a couple of points from the preceding quarter.
Read MoreTop Brands For Customers' Emotional Engagement, February 2014 [TABLE]
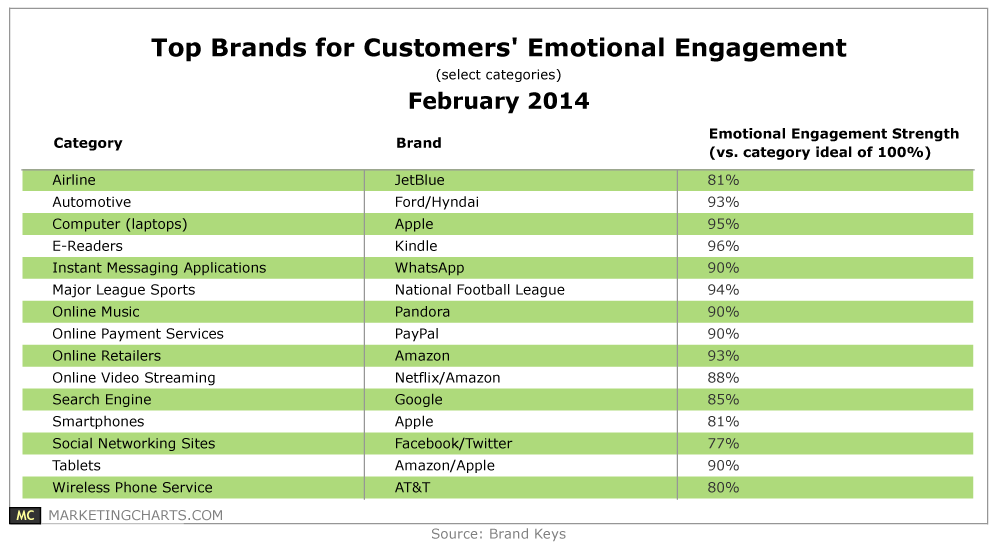
Consumers have never had higher emotional expectations from brands – but that brands’ ability to meet those expectations hasn’t grown as quickly.
Read MoreTwitter User Profile, February 2014 [TABLE]
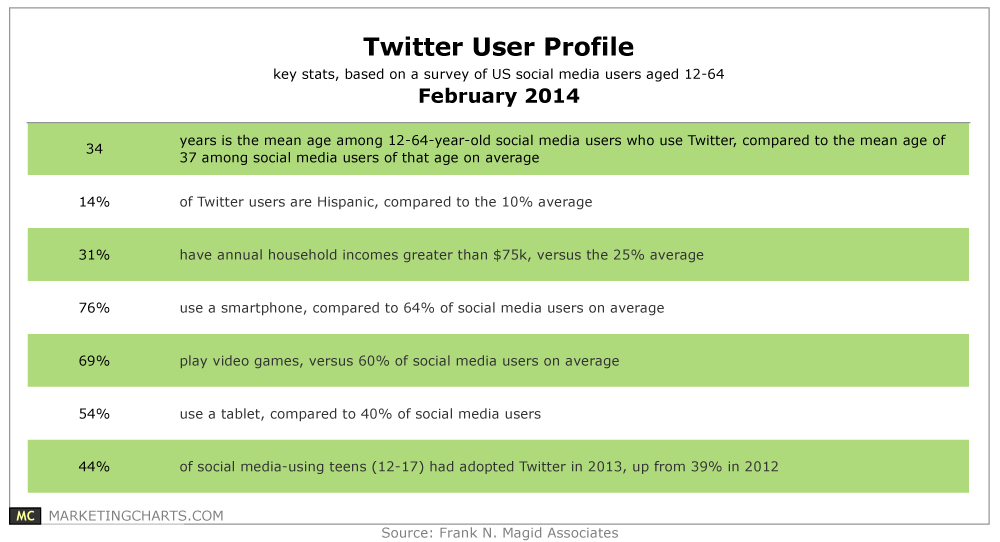
Twitter’s Q4 earnings report may have disappointed in terms of user growth, but recent survey data suggests that its existing users present attractive targets for marketers.
Read More