Posts Tagged ‘Revenues’
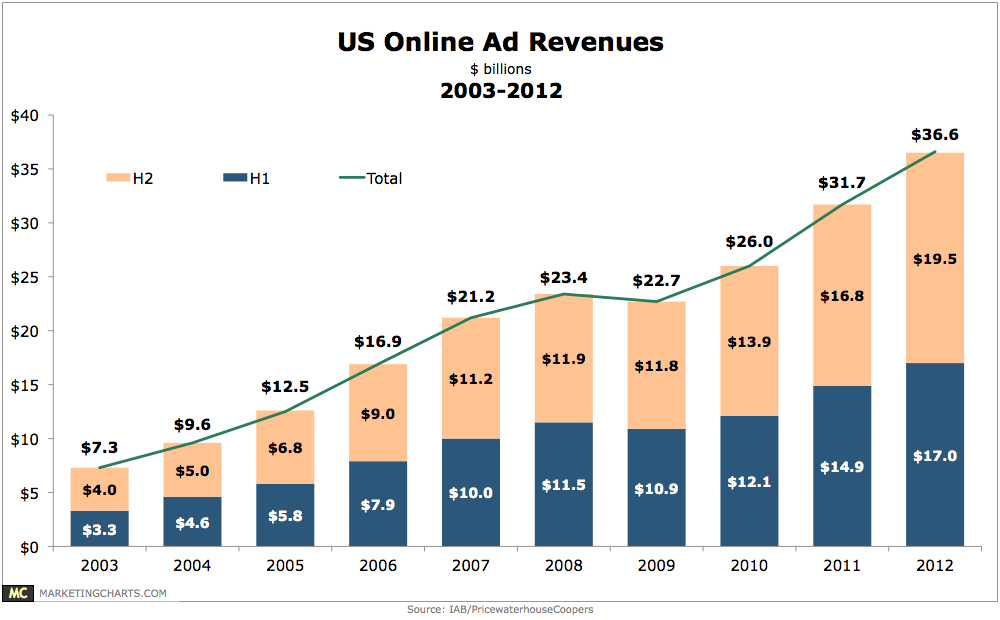
US Online Ad Revenues, 2003-2012 [CHART]
Online ad spend has reached a new peak, hitting $10.31 billion in Q4, up 14.9% year-over-year.
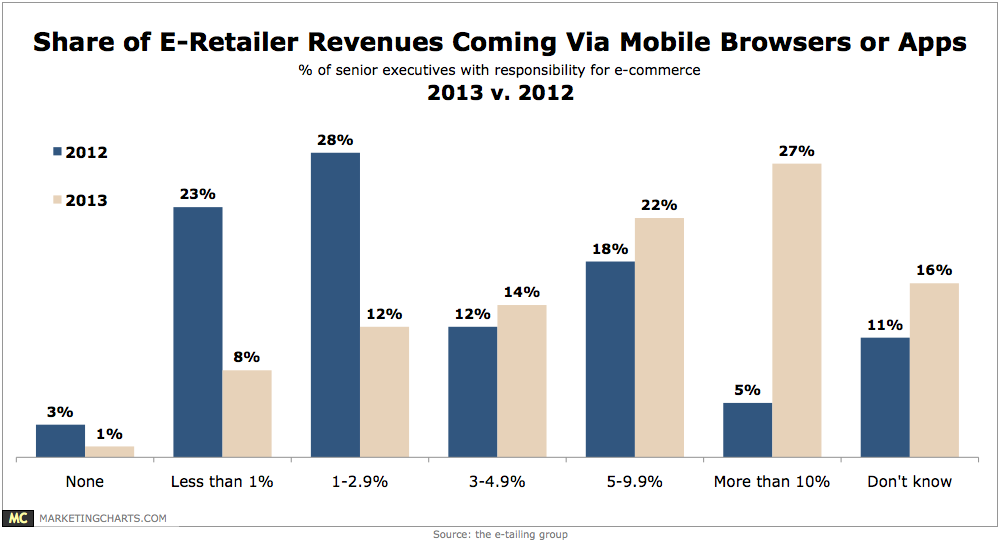
Read MoreRetail mCommerce Revenues, 2012 vs 2013 [CHART]
29% of eCommerce executives say that more than 20% of their traffic comes via mobile browsers or mobile applications, a marked increase from just 3% who reported that level of traffic last year.
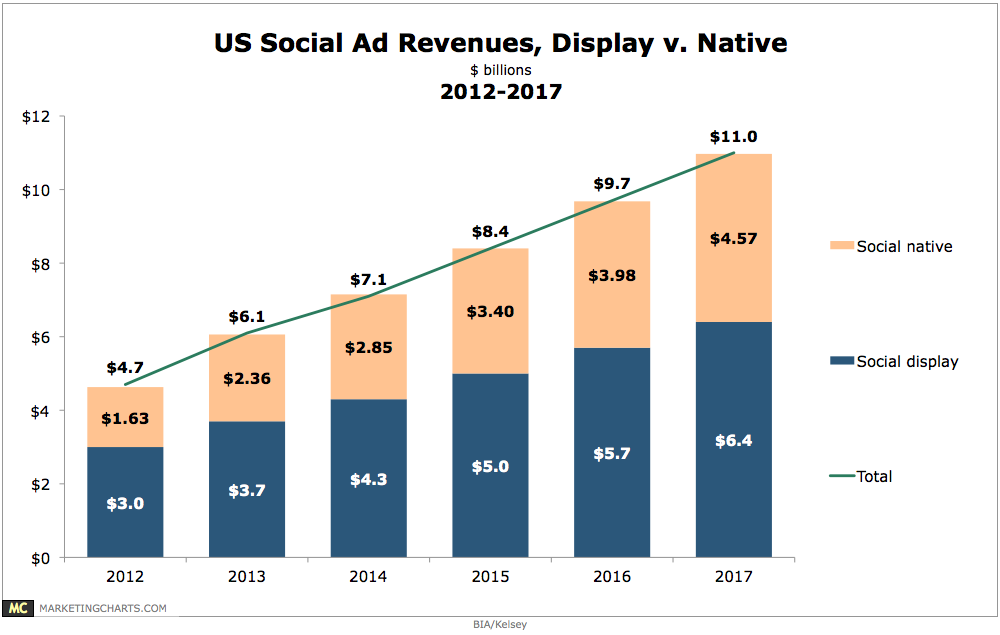
Read MoreUS Display vs Native Social Ad Revenues, 2012-2017 [CHART]
While display will remain the dominant social media advertising unit, native ad formats (such as Twitter’s Promoted Tweets) should grow rapidly over the coming years.
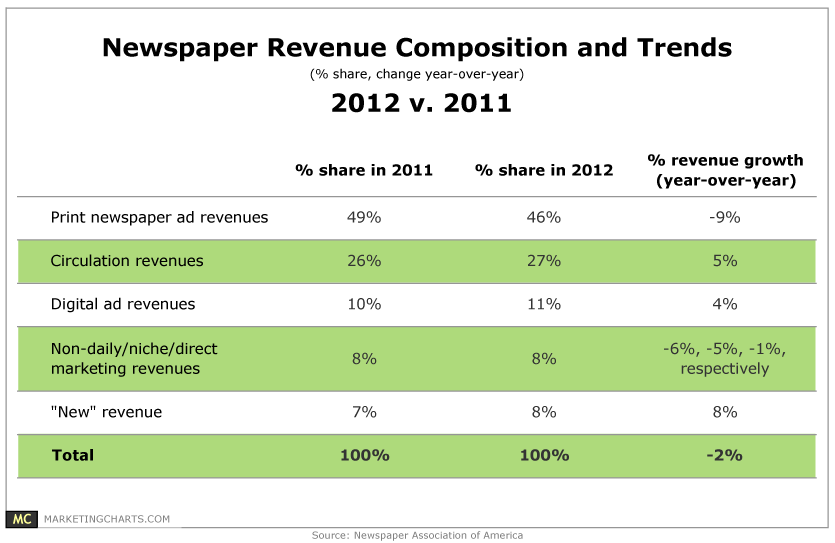
Read MoreNewspaper Revenue Trends, 2011 vs 2012 [TABLE]
Newspaper ad revenues dropped by 6% last year, marking the 7th consecutive year of declines after a 7.3% fall last year.
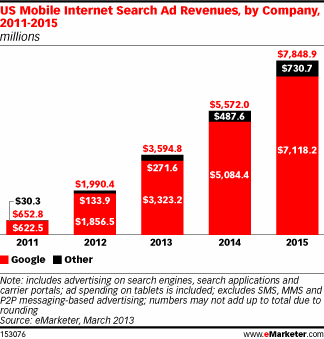
Read MoreUS Mobile Search Ad Revenues, 2011-2015 [CHART]
Google is by far the largest player with 93.3% of US net mobile search ad dollars going to the company last year.
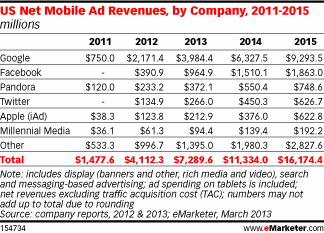
Read MoreUS Net Mobile Ad Revenues By Channel, 2011-2015
eMarketer revised its estimate for 2012 spending only slightly upward from the previous forecast in December 2012.
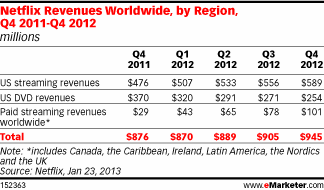
Read MoreGlobal Netflix Revenues By Region, Q4 2011-Q4 2012 [TABLE]
Netflix reported US streaming revenues of $2.19 billion for 2012, with moderate growth from quarter to quarter.
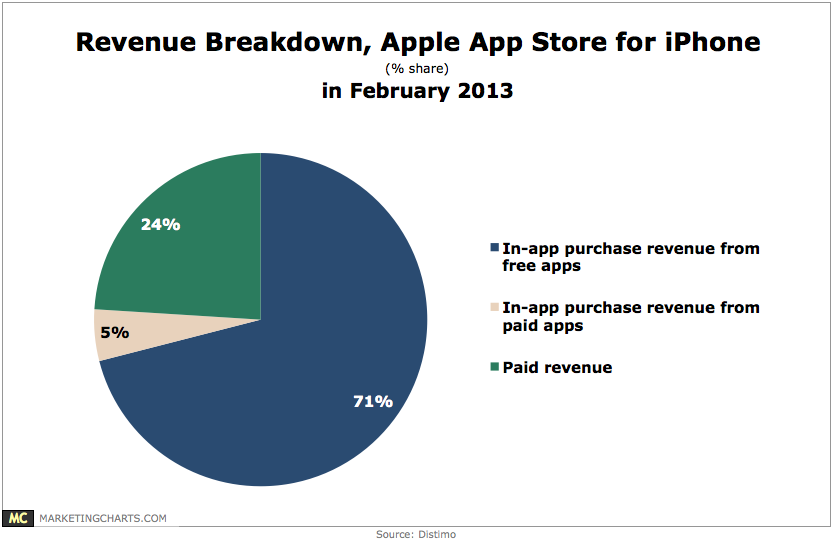
Read MoreApple Free vs Paid App Revenues, February 2013 [CHART]
In-app purchases accounted for a new high of 76% of revenue in the Apple App Store for iPhone in February 2013, up from 53% in January of last year.
Read MoreRadio Advertising Revenue, 2006-2017 [CHART]
Radio revenues will continue to shift in the next 5 years, as income from online advertising grows by about 10.8% annually versus 2.5% growth for over-the-air (OTA) revenues.
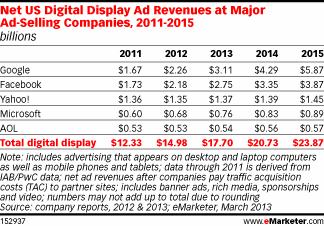
Read MoreOnline Display Advertising Revenues At Major Ad Networks, 2011-2015 [TABLE]
The leader of the pack is Google, with $2.26 billion in net US digital display ad revenues in 2012 and $3.11 billion expected in 2013.
Read More