Posts Tagged ‘Revenues’
US Home Entertainment Rental & Sales Revenues, 2012-2014 [TABLE]
Revenues from US subscription video-on-demand (SVOD) streaming services—such as Netflix—totaled more than $1.91 billion on in H1 2014.
Read MoreUs Online Ad Revenue Share By Company, 2012-2016 [TABLE]
Facebook’s share of the US digital display market rose from 14.8% in 2012 and is projected to hit 21.5% this year.
Read MoreUS Radio Revenue Trends, Q1-Q2 2014 [CHART]
Radio revenues fell by 3% year-over-year in Q2 as gains in digital (+9%) and off-air (+13%) were unable to offset a 5% decline in spot revenues.
Read MoreFacebook Active Mobile Monthly Users & Ad Revenues, Q3 2012 – Q2 2014 [CHART]
Facebook’s advertising revenues grew by 67% year-over-year in Q2 to almost $2.7 billion.
Read MoreB2B Media Industry Revenue Growth, Q1 2014 [CHART]
B2B media industry revenues grew by 4.5% year-over-year to reach $7.1 billion.
Read MoreGlobal Facebook Ad Revenues, 2012-2016 [CHART]
eMarketer expects Facebook’s worldwide advertising revenues to increase 56.4% in 2014 to reach $10.93 billion.
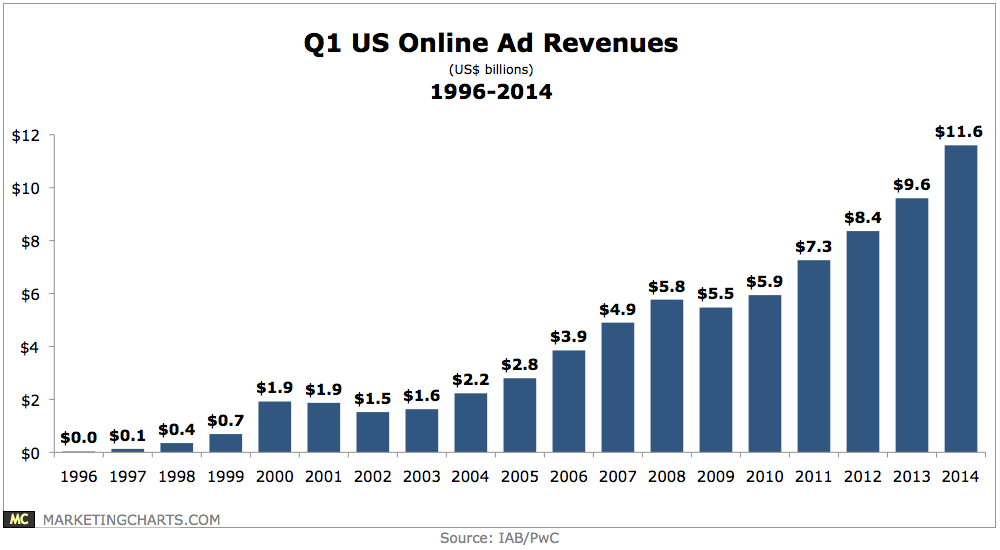
Read MoreQ1 US Online Ad Revenues, 1996-2014 [CHART]
The Q1 mark of $11.6 billion is a new first-quarter peak in online advertising revenues.
Read MoreGlobal Net Mobile Ad Revenues By Company, 2012-2014 [TABLE]
In Q1 2014, Facebook saw a 72% year-over-year rise in total global revenues, driven by mobile, which accounted for 59% of ad revenues during the same period—up from 30% a year prior, the company said.
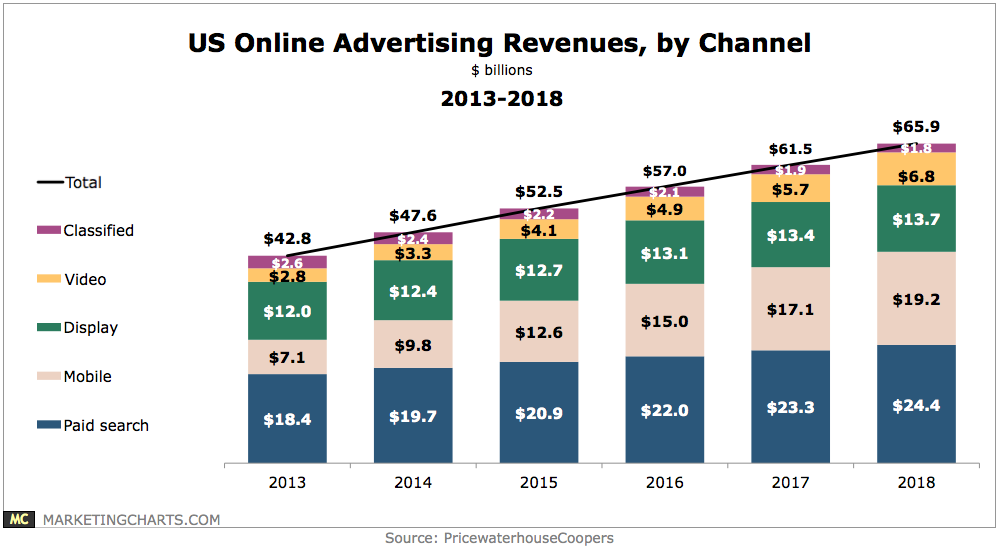
Read MoreUS Online Ad Revenues By Channel, 2013-2018 [CHART]
Mobile ad spending is growing at such a rate that it will soon overtake display advertising to become the second-largest digital advertising channel in the US.
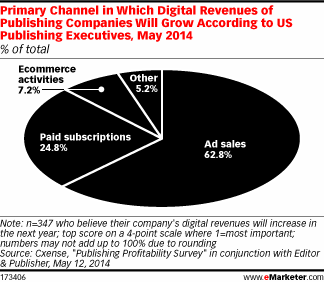
Read MorePrimary Areas Of Online Revenue Growth For Publishers, May 2014 [CHART]
Among those who planned to increase their digital revenues, ad sales were the top channel through which they intended to do so, cited by 62.8% of respondents.
Read More