Posts Tagged ‘Print’
Time Spent With Media By Medium [CHART]
Total time spent with media has stalled in the US, with declines in time spent with TV and other traditional media being offset by increases in time spent with digital media.
Read MoreMedia Consumption Displaced By Smart Speakers [CHART]
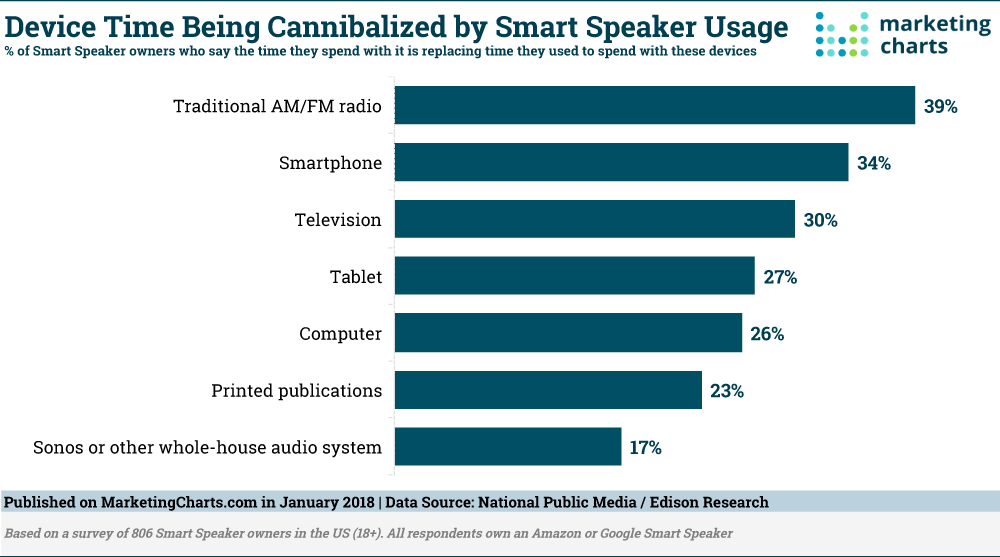
Let’s not call it the year of voice, even if it proves to be… Nonetheless there has been a rash of new research released surrounding voice assistants – and Smart Speakers in particular.
Read MoreUS News Consumption Sources, 2012-2017 [CHART]
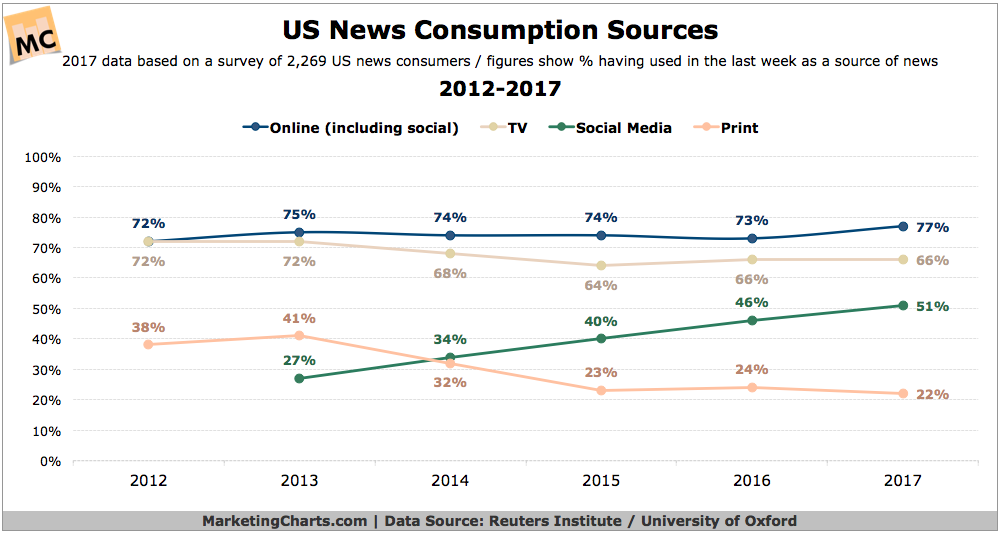
This year for the first time a majority (51%) of Americans surveyed reported using social media as a source of news during the prior week.
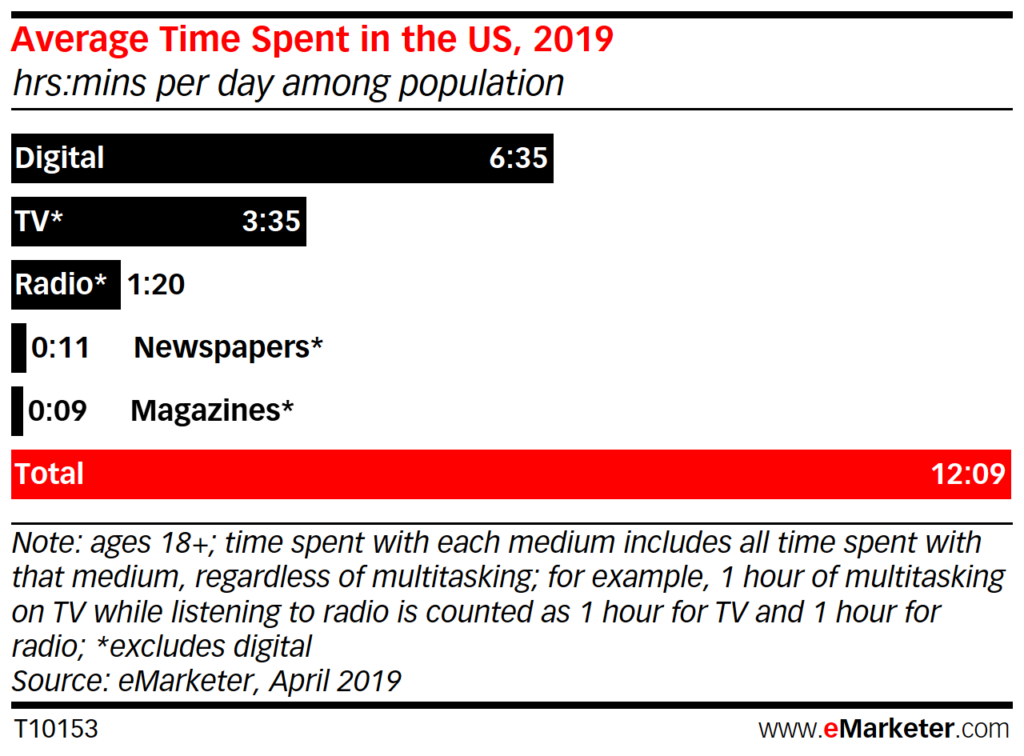
Read MoreAverage Time Spent Per Day With Major Media [CHART]
Thanks to multitasking, US adults’ average daily time spent with major media will slightly exceed 12 hours this year.
Read MorePreferred Sources For Finding Local Products & Services [TABLE]

Eight out of 10 respondents said a search engine was their top choice among a collection of digital and nondigital sources to look up information for local businesses last year.
Read MoreAverage Time Per Day With Major Media [TABLE]
Younger consumers spend more time per week watching video on their desktop or laptop, as well as playing games via their console.
Read MoreSources Of News, 2012-2016 [CHART]
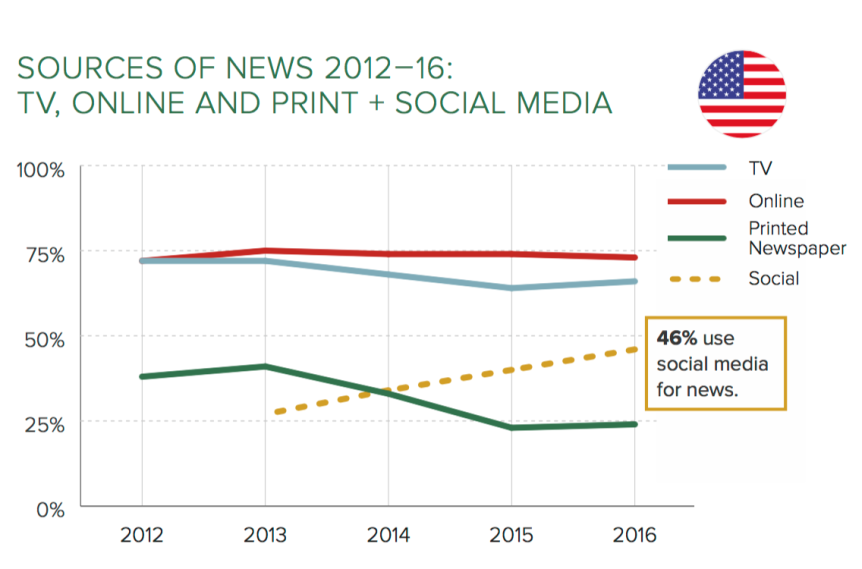
Since 2013, the number of people in the US who say they get their news from social media has doubled—46 percent now use social media for news.
Read MoreAverage Daily Time Spent With Media, 2012-2018 [TABLE]

Thanks to media multitasking, US adults will squeeze an average of 12 hours, 5 minutes per day of media usage into their waking hours this year—nearly an hour more than the average in 2011.
Read MoreHow People Research Political Candidates [CHART]
TV news and TV debates are still the primary ways in which US internet users research and learn about political candidates prior to elections.
Read MoreUS Mothers' Media Consumption, 2010-2015 [CHART]
More than nine in 10 mothers with children under 18 in the household are internet users.
Read More