Posts Tagged ‘Political Advertising’
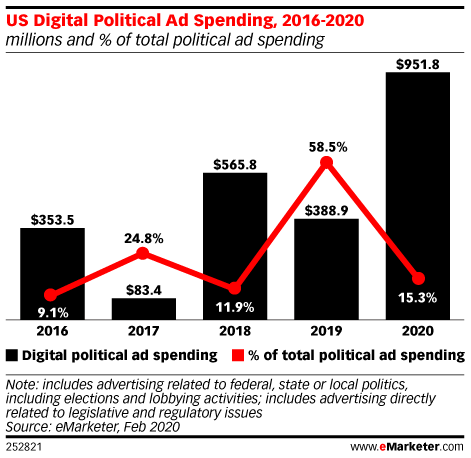
US Digital Political Ad Spending, 2016-2020
Digital political ad spending is expected to surge from $388.9 million last year to $954.8 million this year.
Read MoreDigital Marketing News This Week
Topics: The most siginficant announcements to come out of Apple’s 2020 Developer Conference; Keen, Google’s new social collaboration tool; Google Images fact checks; Patagonia joins the growing Facebook advertising boycott; Devin Nunes’ Cow wins in court; YouTube introduces shoppable commercials; Pandora introduces analytics for podcasters; Facebook continues to harbor hate; mobile messaging app stats.
Read MoreDigital Marketing News This Week
Twitter’s new voice feature; Target recognizes Juneteenth; Spotify lands DC Comics podcasts; Netflix’ Reid Hastings donates $120 million to black colleges; Fox News doesn’t get Monty Python; Facebook’s Ad Library; #RIPTacoBell; Google Fragment Text Chrome extension; and Twitch growth statistics.
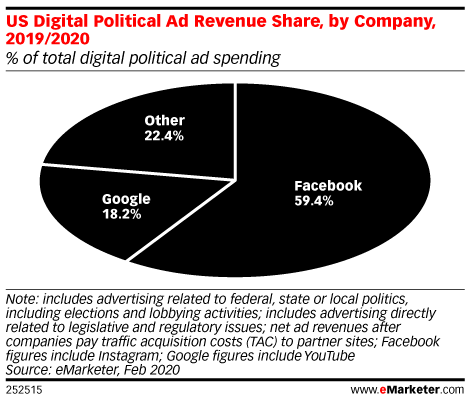
Read MoreUS Digital Political Ad Spending Share
Google and Facebook already control 60.8% of the total US digital ad market.
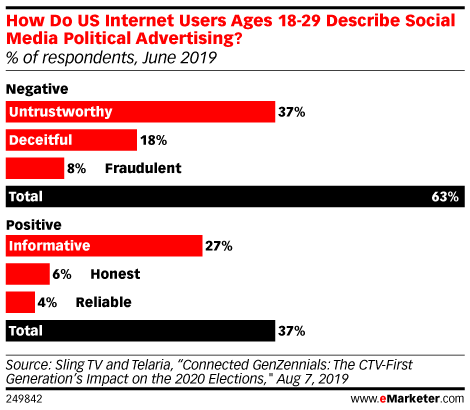
Read MoreMillennials' Attitides Toward Social Media Political Advertising [CHART]
Sixty-three percent of Millennials have a negative attitude toward social media political advertising, according to a survey by Sling TV and Telaria.
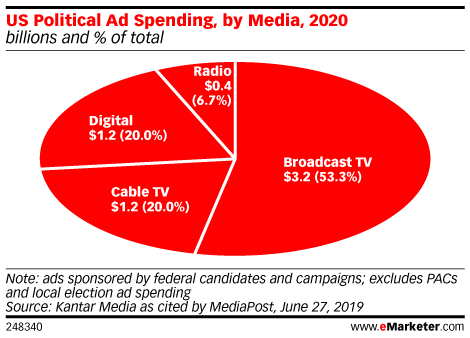
Read MorePolitical Ad Spending By Media, 2020 [CHART]
Of the $6 billion in political campaign spending this cycle, Kantar expects 20%, or $1.2 billion, to go to digital. TV still wins the lion’s share of campaign budgets, with almost three-quarters of the total split between broadcast and cable TV.
Read MorePolitical Ad Spending, 2014-2020 [CHART]
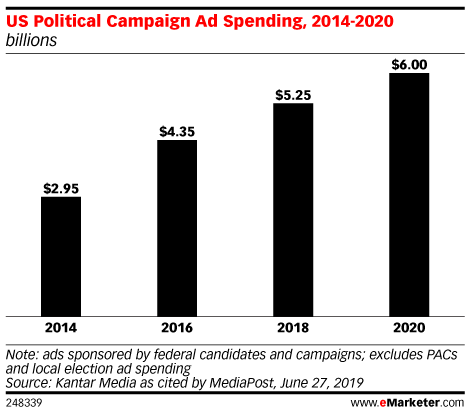
Growth in political ad spending is expected to slow dramatically during the 2019-2020 election cycle, according to Kantar Media, which predicts political campaigns for US federal office will spend $6 billion on paid media placements this year. But a greater share than ever will be directed toward digital channels.
Read MoreUS Political Ad Spending Allocations, 2012 vs 2016 [CHART]
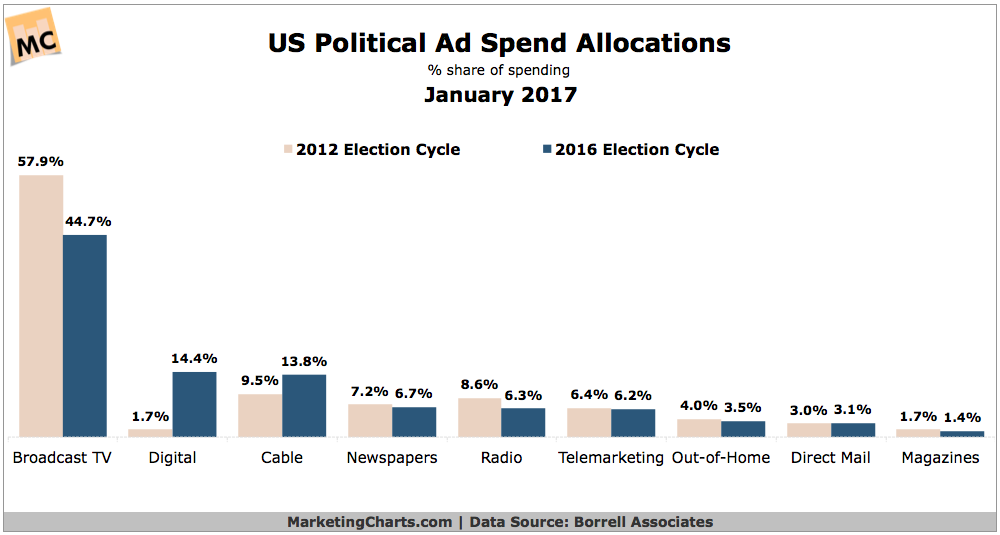
Political advertising reached $9.8 billion in the 2016 election year, marking a more than 4% increase from the 2012 election cycle ($9.4 billion) and representing a new record.
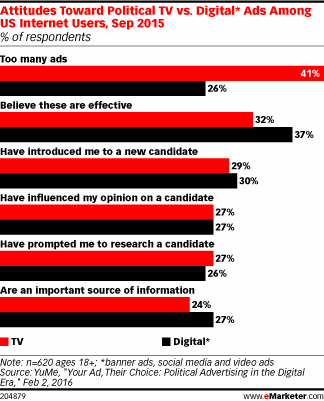
Read MoreAttitudes Toward Political TV & Online Ads [CHART]
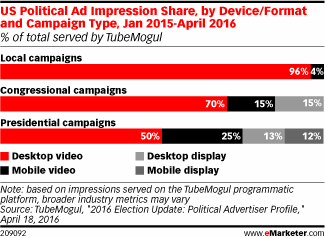
The presidential campaigns have had the most variation in ads served.
Read MorePolitical Ad Impressions By Device & Campaign Type [CHART]
Desktop video ads have made up the bulk of each campaign’s approach. Local campaigns concentrated on this format the most since the beginning of 2015.
Read More