Posts Tagged ‘Personal Care Marketing’
Consumer Spending By Generation [TABLE]
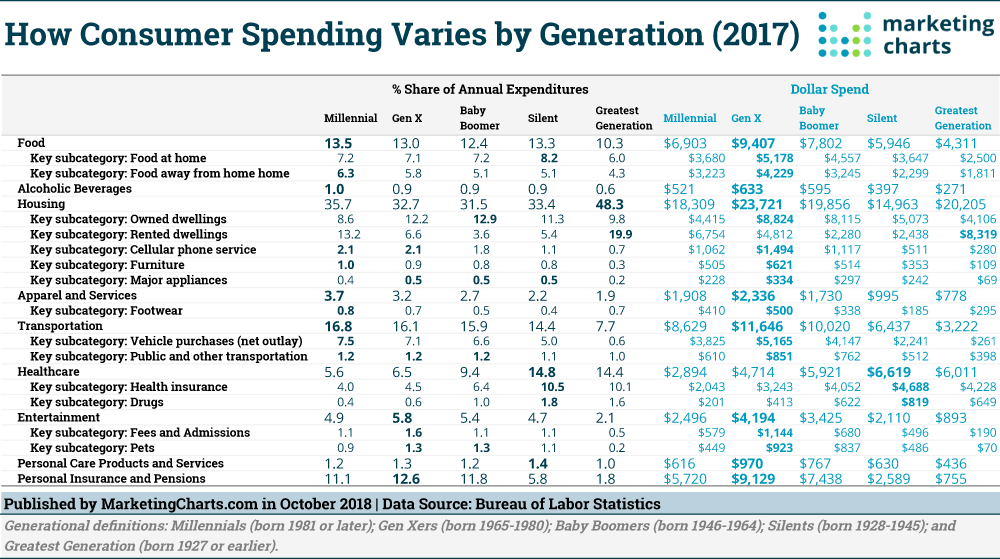
Gen Xers had the highest average income before taxes last year, of roughly $95k, according to the latest annual Consumer Expenditure Survey from the Bureau of Labor Statistics, and they averaged the most spending, too.
Read MoreVoice Commerce Appeal By Product Categories [CHART]
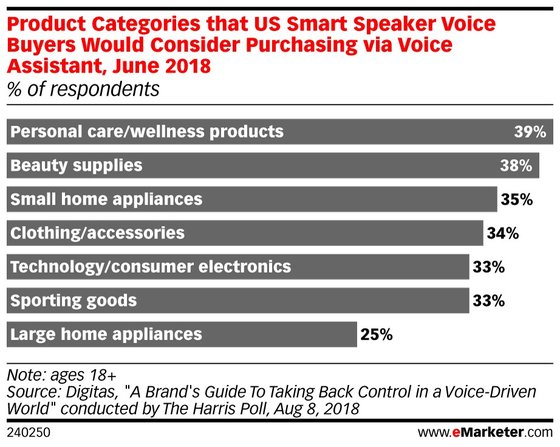
According to a Digitas survey, conducted by The Harris Poll, US smart speaker buyers are most receptive to buying personal care/wellness products (39%) and beauty supplies (38%) via voice commerce.
Read MoreAmazon Sales Growth By Retail Category [CHART]
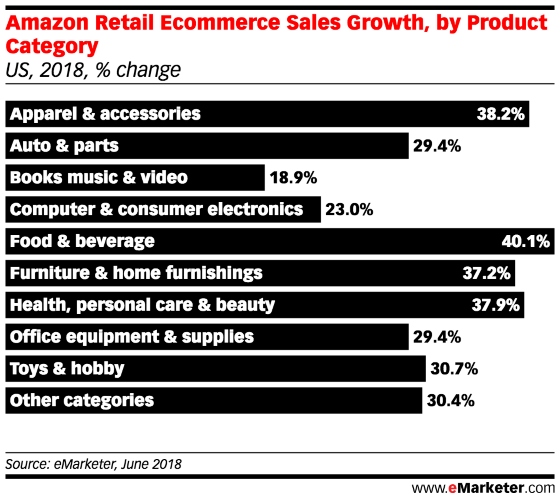
Food is one of the most underpenetrated digital sales categories in the US: eMarketer expects only 2.8% of food and beverage sales will occur online this year.
Read MoreInstagram Influence [INFOGRAPHIC]

This infographic from X-Cart illustrates the many ways in which Instagram is exerting its influence as a social media channel.
Read MoreBrands Working With Instagram Influencers By Industry [CHART]
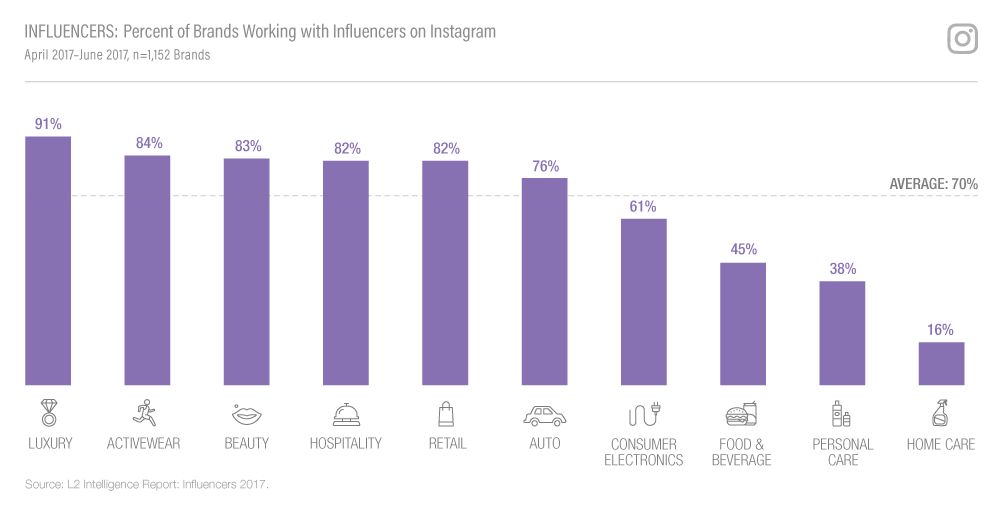
According to L2’s recent Influencers briefing, 70% of brands use influencers to boost reach and enhance content.
Read MoreCustomer Satisfaction With the Retail, 2013 vs 2014 [CHART]
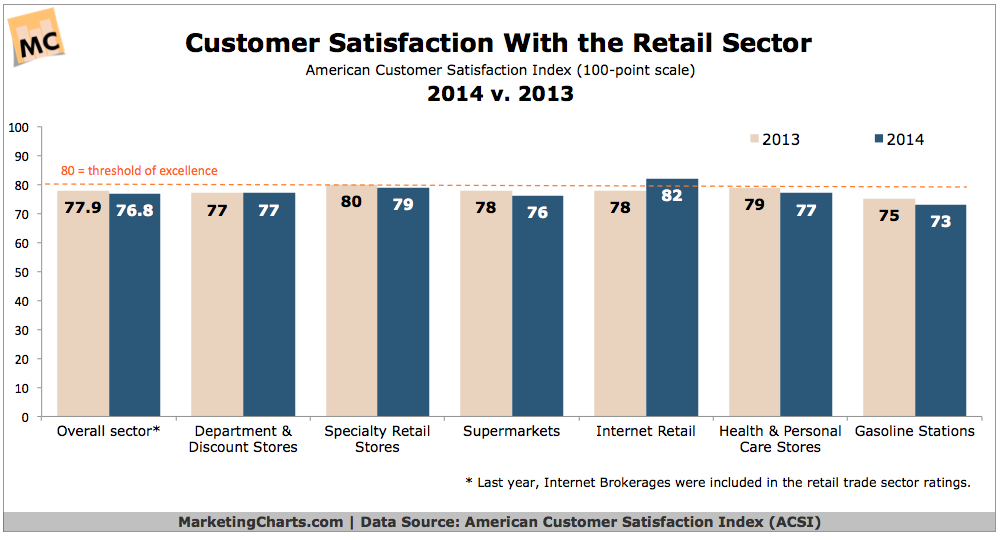
Customer satisfaction with almost all forms of traditional retail dropped, while satisfaction with online retailers improved.
Read MoreBaby Boomers’ Spending Trends, February 2014 [TABLE]
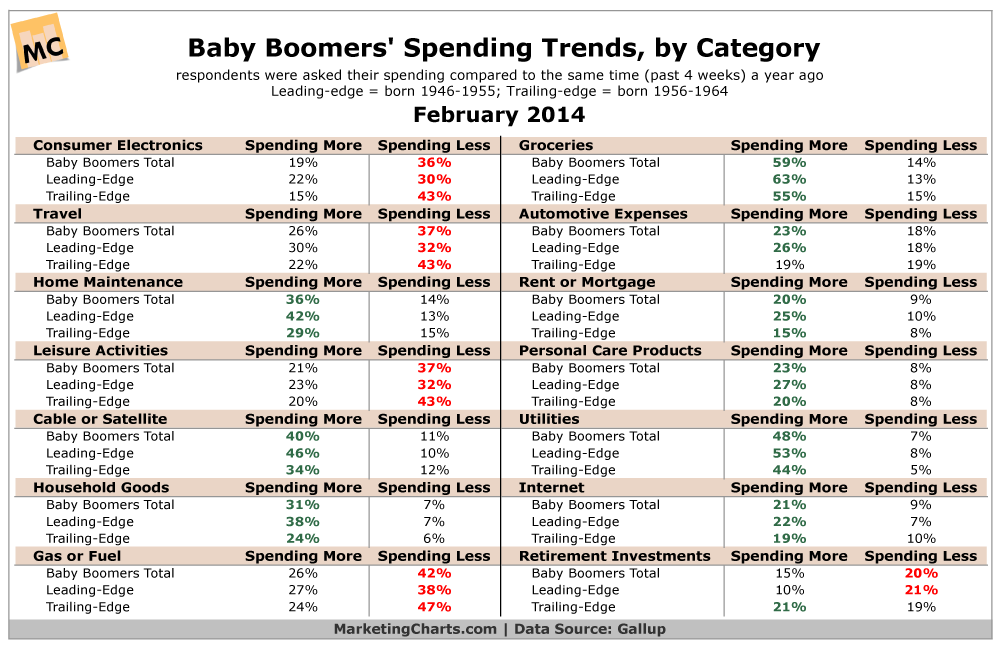
Baby Boomers on the whole report spending more than they were a year ago.
Read MoreBrand Loyalty By Gender, December 2014 [CHART]
Who’s more brand loyal – men or women? Probably the only real correct answer is that it depends.
Read MoreUS Millennial Teens' Spending By Category, October 2014 [CHART]
Half of teen spending is concentrated in 3 categories.
Read MoreUS Retail Sales By Category [CHART]
Americans spend $600 billion a year on groceries, the largest retail category by far. Less than 1% of those sales occur online.
Read More