Posts Tagged ‘Mobile Social’
Social Media Use Frequency By Channel [CHART]
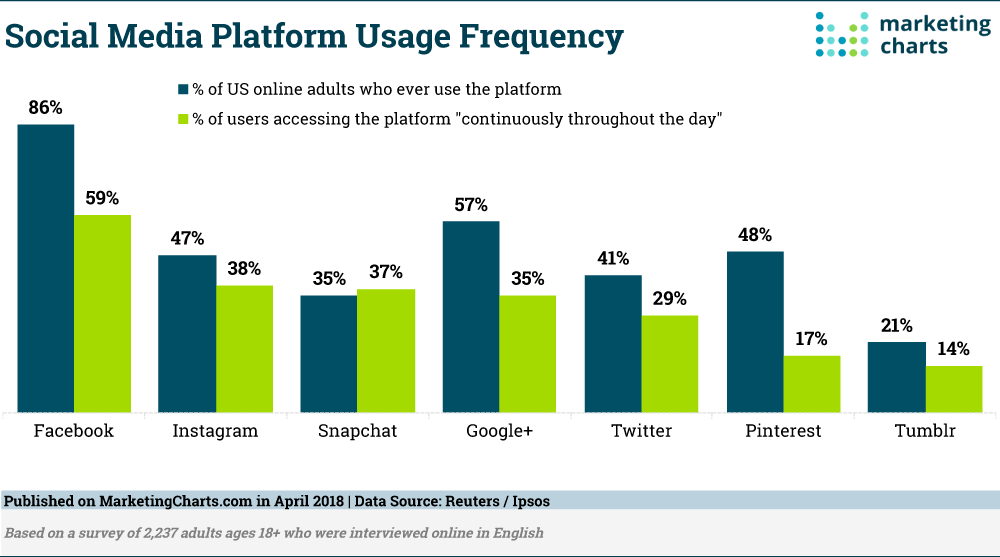
About 7 in 10 American adults report being online ‘almost constantly’ (26%) or ‘several times a day’ (43%), according to recent data from the Pew Research Center. Many of those are likely spending their online time visiting social media platforms.
Read MoreSmartphone Activities Americans Over 50 [CHART]
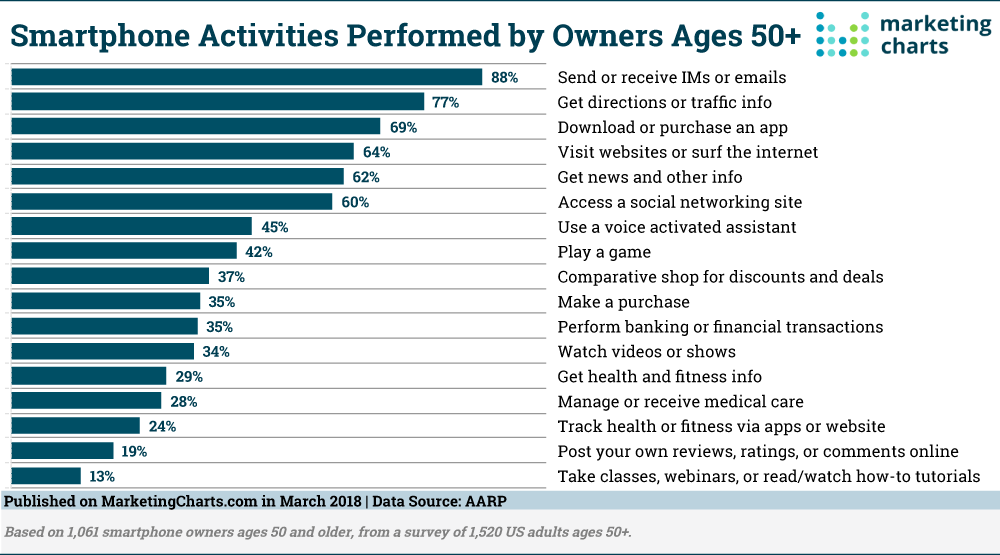
Seven in 10 Americans ages 50 and older own a smartphone, says the AARP in research, and those Americans are most likely to use their devices for messaging.
Read MoreDigital Marketing Reassessment [INFOGRAPHIC]
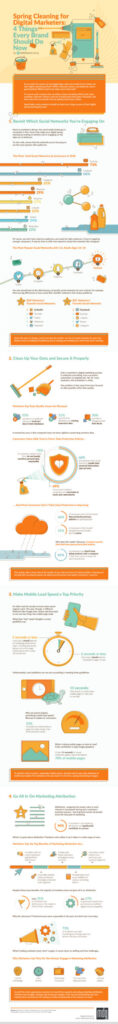
This infographic recommends four steps brands should take to reassess their digital marketing during their digital spring cleaning.
Read MoreInstagram User Penetration, 2016-2021 [CHART]
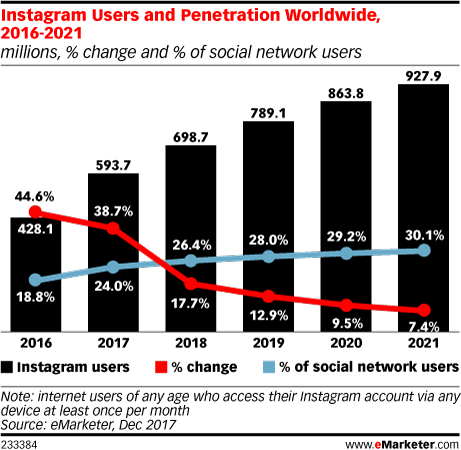
One in three people—2.48 billion—worldwide used a social network in 2017, eMarketer estimates. Rising social network use in emerging markets in Asia-Pacific, Latin America and the Middle East and Africa drove an 8.7% gain over 2016.
Read MoreWebsite Referrals By Social Channel, 2016-2017 [CHART]
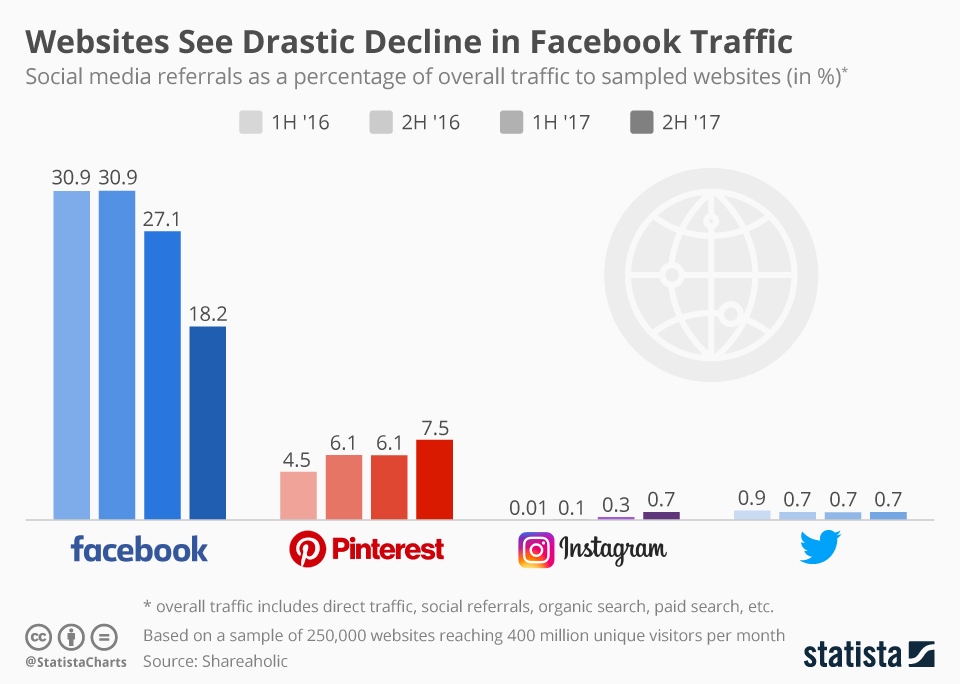
According to a report by Shareaholic, the percentage of website traffic coming from Facebook has already declined drastically in the second half of 2017.
Read MoreTime Spent With Social Media By Generation & Device [CHART]
It’s no surprise that Millennials’ social media time is mainly spent on smartphones. But what about older folks—are Baby Boomers and older users mostly mobile when it comes to social? Turns out, the answer is yes, if not quite to the same extent.
Read MoreSnapchat Advertising Revenues, 2016-2019 [PODCAST]
eMarketer expects Snapchat’s US ad revenues will total $642.5 million this year. That’s down from $770 million eMarketer predicted in March 2017, and from $805 million forecast in July 2016.
Read MoreTop Small Business Marketing Channels [CHART]
Despite potential financial restrictions, marketing remains a priority for small business decision-makers.
Read MoreLive Video Streaming [INFOGRAPHIC]

This infographic from Koeppel Direct illustrates the rise of live video streaming.
Read MoreGamers Favorite Mobile App Categories By Gender [TABLE]
Jun Group’s survey found that a slightly higher percentage of females named games as their favorite type of mobile app than did males.
Read More