Posts Tagged ‘Mobile Phones’
Market Share Of Mobile Device Types, 2013 vs 2014 [CHART]
In 2013, a mere 2% of the kinds of devices Flurry saw were Phablets, whereas in 2014, Phablets represent 10% of all device types.
Read MoreDevice Penetration Among US College Students, July 2014 [CHART]
College students (aged 18-34) own an average of 6.8 devices each, steady from last year.
Read MoreShare Of eCommerce Revenue By Channel & Device, 2013 [CHART]
Email drove 26.7% of revenues on mobile phones last year, compared to 23.1% on tablets and 20.9% on desktops.
Read MoreAmericans' Small-Ticket Budget Cutbacks, June 2013 vs June 2014 [CHART]
Fewer Americans are reporting a cutback in small-ticket purchases compared to a year ago.
Read MoreShare Of US Time Spent With Online Media By Platform, February 2013 – May 2014 [CHART]
After exceeding the desktop web in share of digital time spent in January, mobile apps accounted for a majority 51% share of total digital consumption in May.
Read MoreDaily Social Media Activity On Computers & Mobile Phones, June 2014 [CHART]
Some 46.5% of respondents said they read or update Facebook daily from a computer, with 29.3% doing so daily from a mobile phone.
Read MoreWestern European Mobile Phone Users By Country, 2012-2018 [TABLE]
Digital ad spending in Germany rose by over 9% in 2013 and will grow by a further 9.0% this year.
Read MoreMobile’s Share Of Email Opens By Daypart, H2 2013 [CHART]
Mobile’s share of email opens continues to increase, with various sources reporting that share to be 50% or higher.
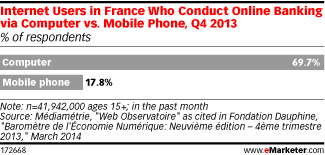
Read MoreFrench Consumers Who Bank Online, Computer vs Mobile, Q4 2013 [CHART]
Nearly seven in 10 French web users ages 15 and older said they had carried out at least one banking activity on a computer at home in the month before Q4 2013 polling.
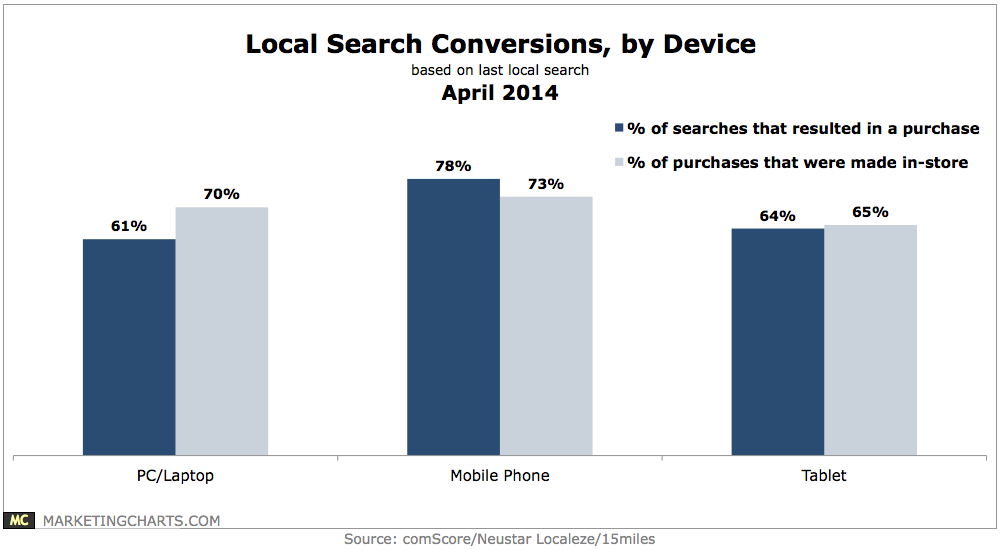
Read MoreLocal Search Conversions By Device, April 2014 [CHART]
Some 78% of local searches conducted on a mobile phone result in a purchase, and 73% of those purchases are made in-store.
Read More