Posts Tagged ‘Mobile Apps’
Brands' Facebook & Instagram Integration, December 2013 [TABLE]
Nearly nine in 10 of the brands had both an Instagram and a Facebook account.
Read MoreMost Essential Mobile Tactics For Engagement, February 2014 [CHART]
Mobile applications emerge as the clear winner; they’re not only used by the most respondents (81%), but are considered an essential channel by the largest proportion (38%).
Read More7 Types Of American Smart Phone Users [TABLE]
Experian Marketing Services has released a report segmenting US smartphone owners into 7 groups.
Read MoreMonthly Time Spent On Social Networks, July 2013 [TABLE]
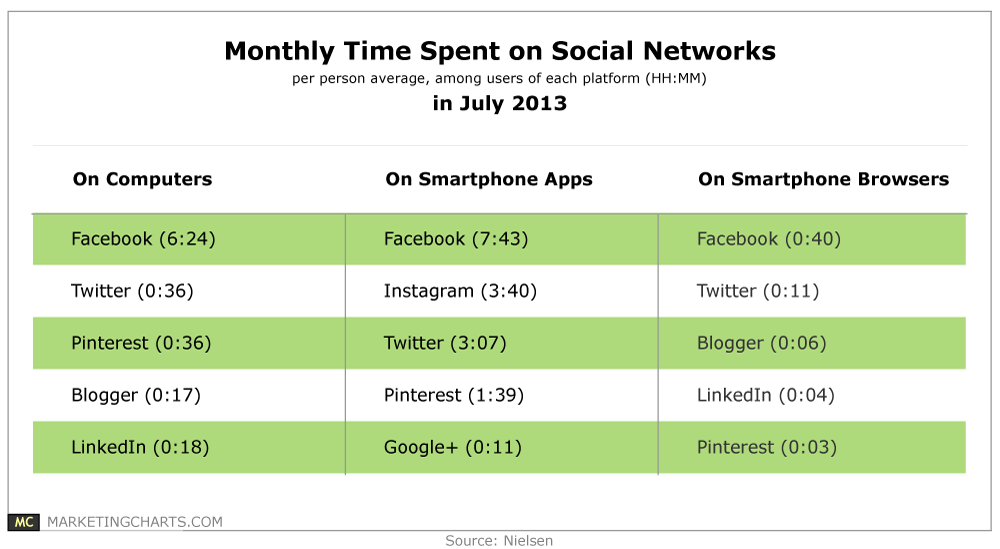
Among smartphone app users in July 2013, Instagram users were spending more time per person per month on the platform (3 hours and 40 minutes) than Twitter users (3 hours and 7 minutes).
Read MoreGlobal Traveler, 2014 [INFOGRAPHIC]
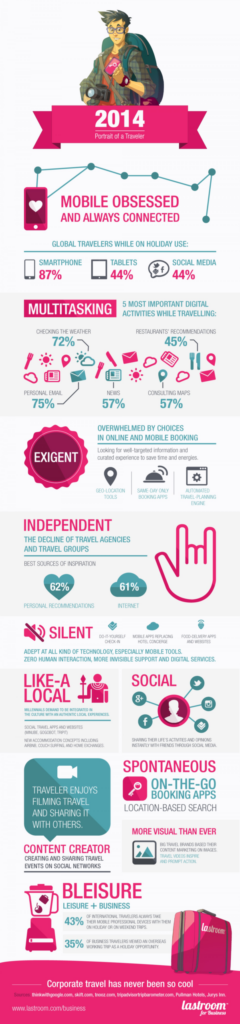
This infographic from LastRoom paints a picture of the behavior of the global traveler of 2014.
Read MoreTop Brands For Customers' Emotional Engagement, February 2014 [TABLE]
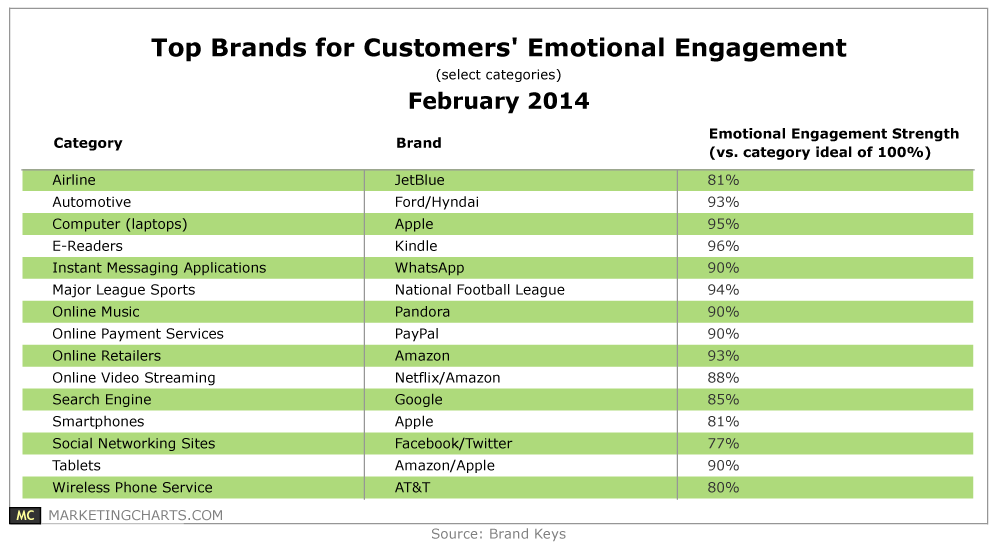
Consumers have never had higher emotional expectations from brands – but that brands’ ability to meet those expectations hasn’t grown as quickly.
Read MoreHow Online Channels Influence Shopping, Q2 2013 [TABLE]
Product reviews were the leading digital tool that influenced US internet users to shop at a specific retailer (39%).
Read MoreGrowing Privacy Concerns Across Popular Online Activities, 2013 vs 2014 [CHART]
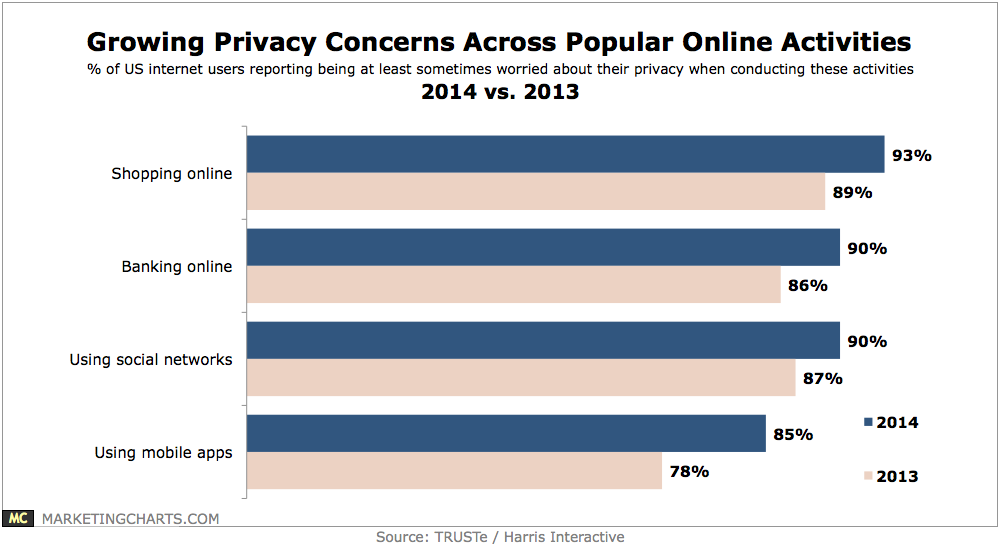
92% of American internet users report worrying about their privacy online at least sometimes, a figure that has remained consistent over the past couple of years.
Read MoreHow People Find New Mobile Apps, March 2013 [CHART]
55% of US smartphone users typically browsed the app store to find new mobile apps.
Read MoreGlobal Mobile App Downloads, 2013 & 2017 [CHART]
Portio Research estimated the number of annual downloads would top 200 billion in 2017—two-and-a-half times 2013’s 82 billion.
Read More