Posts Tagged ‘Metrics’
Preferred Video Advertising Audience Measurement Metrics, 2012 & 2013 [TABLE]
This year, 36% of ad executives indicated that their clients placed the highest value on gross rating points (GRP) or target rating points (TRP) to measure the size of their audience.
Read MoreAd Click-Through Rate By Format, 2012 [CHART]
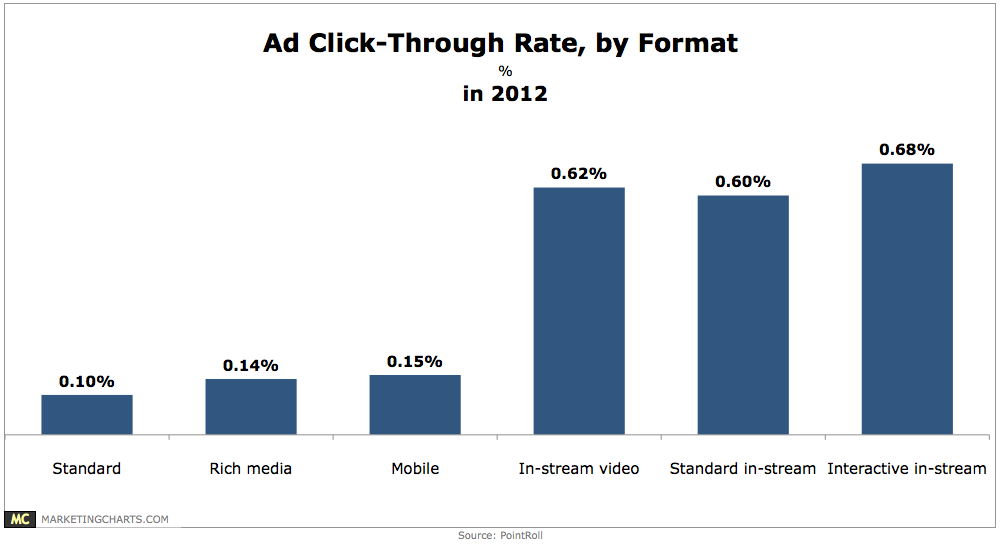
In-stream video ads achieved an average click-through rate (CTR) of 0.62% last year, far outpacing mobile (0.15%), rich media (0.14%) and standard banner (0.1%) ads.
Read MoreCarnival Cruise's Spotify Campaign Metrics, November 2012 [TABLE]
From mid-October 2012 through the end of November, Carnival launched a custom music playlist called Carnival Cruise Tunes.
Read MoreInteractive Online Video Advertising Effect On Branding, Q2 2012 [CHART]
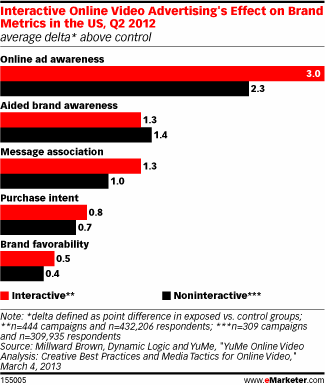
A Q2 2012 study from Millward Brown, Dynamic Logic and YuMe found that in most cases, interactive ads delivered greater brand metric results.
Read MoreUS Online Video Advertising CPM, 2010-2017 [TABLE]
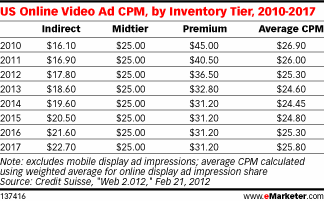
CPM for midtier sites and placements in 2013 will be approximately $25 and reach nearly $33 for premium destinations.
Read MoreNative vs. Banner Ads, May 2013 [CHART]
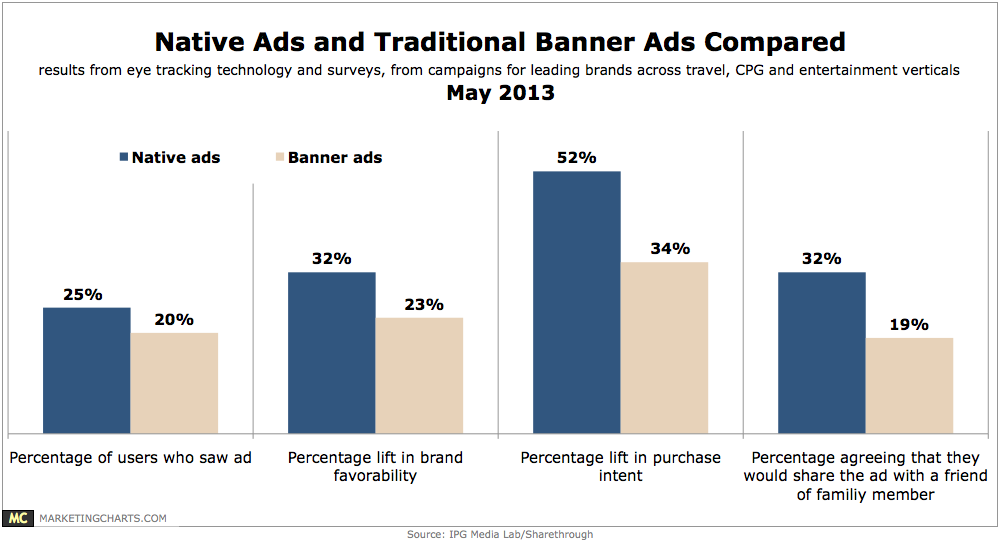
A study pitting native ads against banner ads has found the former attracting more attention and generating more lift.
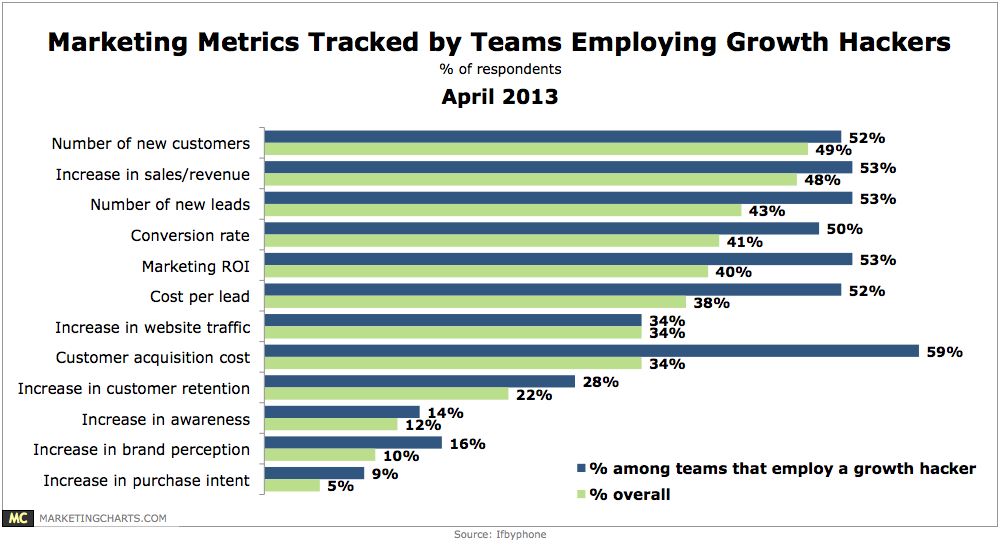
Read MoreOf Marketing Metrics & "Growth Hackers" (Yeah, You Heard Me), April 2013 [CHART]
25% of marketers surveyed indicate that their team employs a growth hacker.
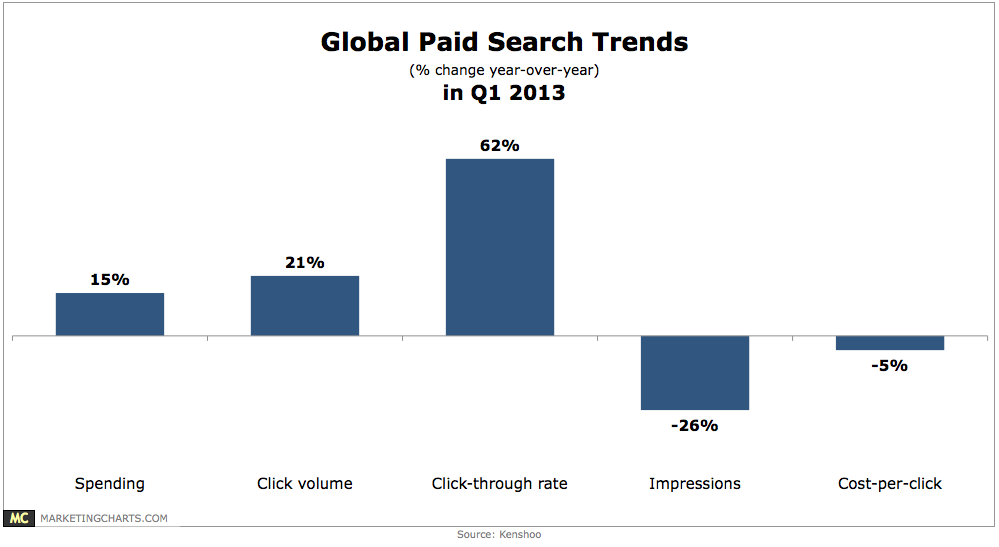
Read MoreGlobal Search Advertising Trends, Q1 2013 [CHART]
On a global basis, paid search click volume (+21%) and click-through rates (+62%) each saw strong growth, with spending up 15%.
Read MoreMonthly Average CTR For Q1 2013 By Mobile Device [CHART]
Advertisers devoted roughly three-quarters of their budgets to iOS devices during Q1 2013.
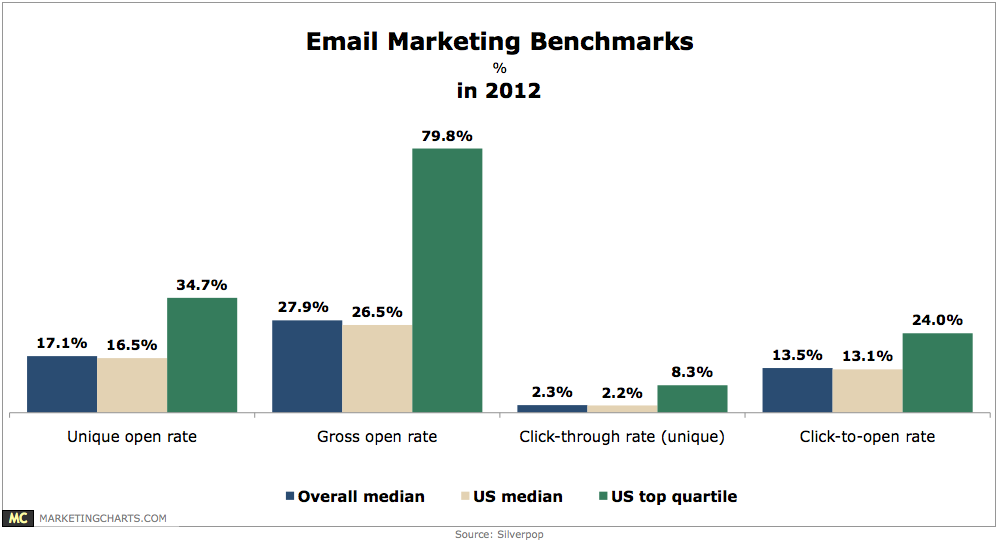
Read MoreEmail Marketing Benchmarks, 2012 [CHART]
The median email CTR in the US stood at 2.2% last year, and the mean rate at 3.3%, but the top quartile of performers achieved an average rate of 8.3%.
Read More