Posts Tagged ‘Men’
Differences Between Male & Female Millionaires, February 2014 [TABLE]
9% of US adults qualify as being millionaires (personal net worth of at least $1 million).
Read MoreMale Attitudes Toward Shopping, February 2014 [TABLE]
More than 6 in 10 men aged 18-49 said they’re open to choosing new brands across several categories when shopping for the household.
Read MoreUSA Today 2014 Super Bowl Ad Ratings [INFOGRAPHIC]
This infographic by USA Today illustrates the top commercials for the 2014 Super Bowl and their return on investment.
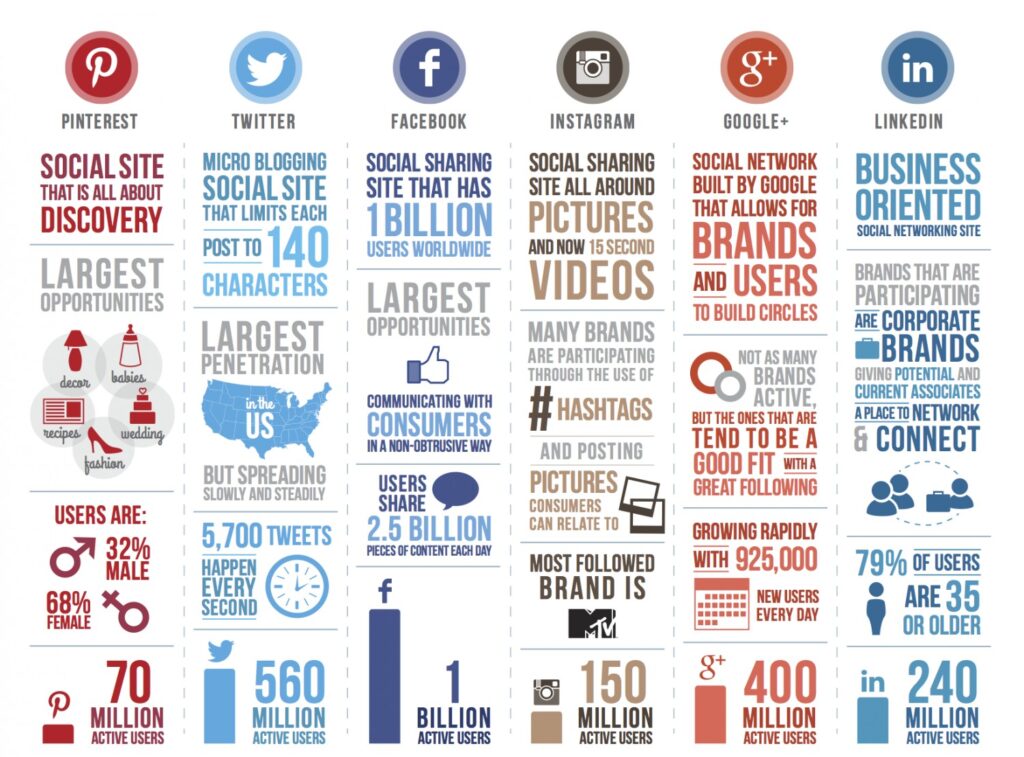
Read MoreSocial Media Users In 2013 By Network [INFOGRAPHIC]
This infographic by Mark Taylor illustrates 2013 statistics for Pinterest, Twitter, Facebook, Instagram, Google+ and LinkedIn.
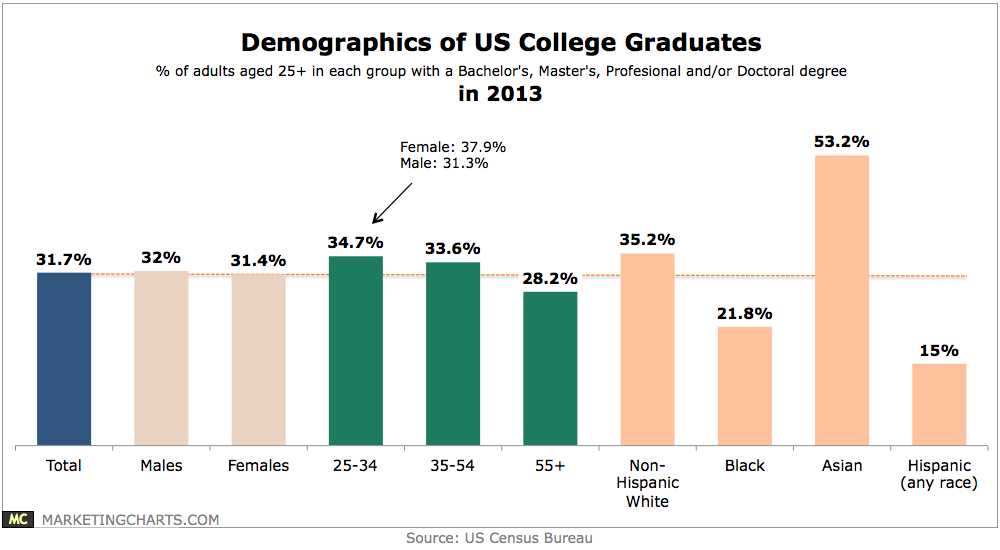
Read MoreDemographics Of US College Graduates In 2013 [CHART]
About 31.7% of Americans aged 25 years and older last year had earned a Bachelor’s, Master’s, Professional and/or Doctoral degree, up from 30.4% in 2011.
Read MoreLikelihood Of Making A Purchase From A Social Network, January 2014 [CHART]
Almost 1 in 5 social network users will make a purchase directly through a social platform this year.
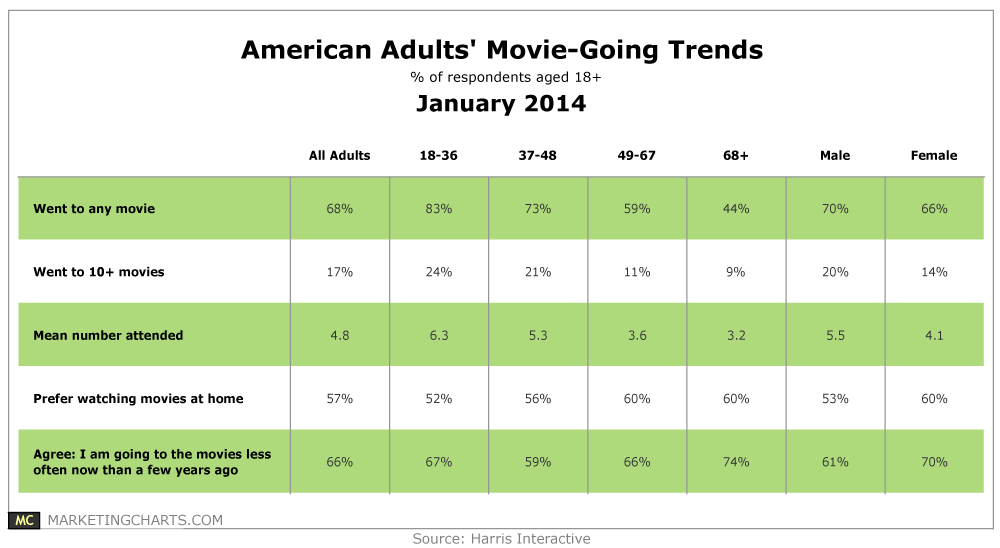
Read MoreAmericans' Movie-Going Frequency By Age, January 2014 [TABLE]
Americans went to about 5 movies on average last year.
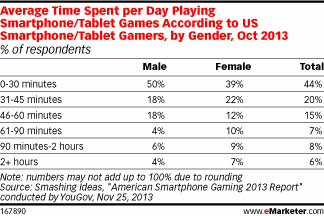
Read MoreAverage Daily Time Spent Playing Mobile Games By Gender, October 2013 [TABLE]
More than three-quarters of time US internet users spent with such content was on mobile, with desktop claiming just 22%.
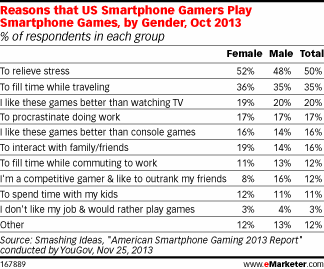
Read MoreReasons US Smart Phone Owners Play Mobile Games By Gender, October 2013 [VIDEO]
Half of US smart phone owners cited stress relief as their reason for playing smart phone games, the No. 1 response.
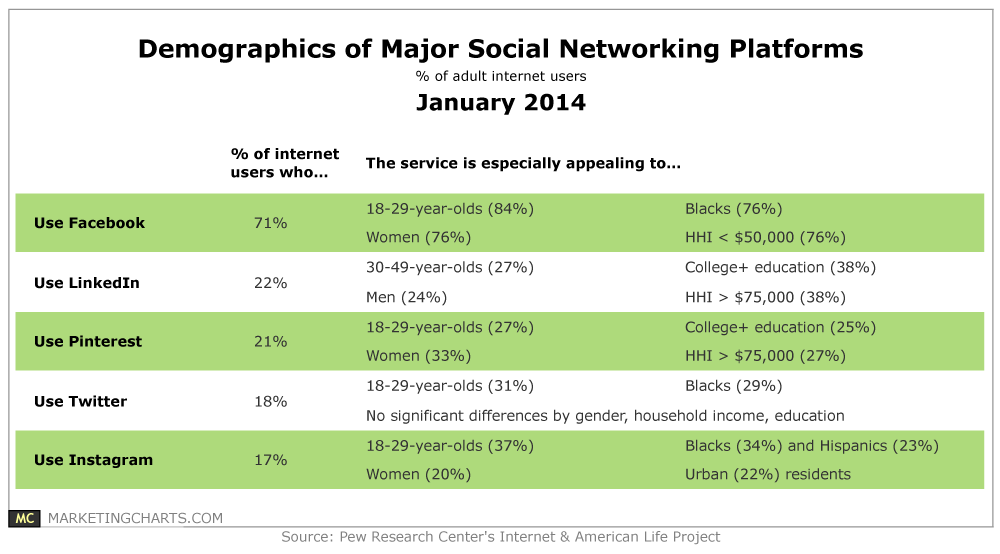
Read MoreDemographics Of Major Social Networks, January 2014 [TABLE]
The Pew Internet & American Life Project provides some insights into which online adults are most drawn to 5 key platforms,
Read More
