Posts Tagged ‘Kindle Fire’
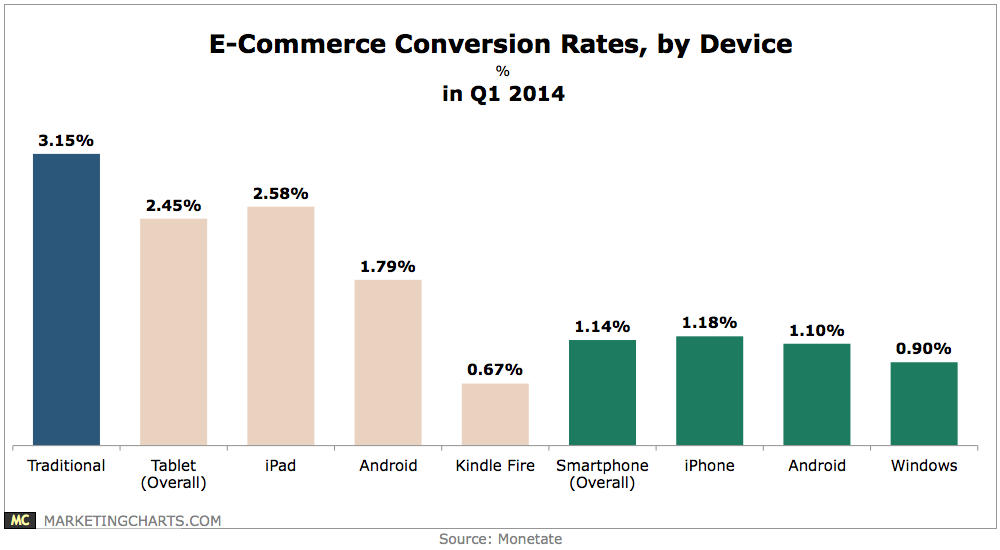
E-Commerce Conversion Rates By Device, Q1 2014 [CHART]
Tablet (2.45%) and smartphone (1.14%) conversion rates trailed traditional computers (3.15%) again in Q1.
Read MoreNorth American Android Web Traffic By Manufacturer, February 2014 [CHART]
Samsung is the clear winner with 55.5% of all Android traffic. Tied for second is Amazon with 8.2%, which makes only the Kindle Fire Tablet.
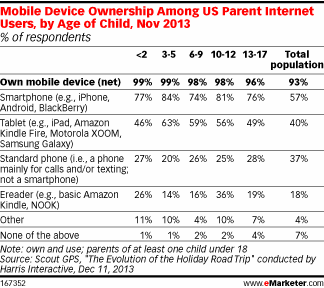
Read MoreMobile Devices American Parents Own By Age Of Child, November 2013 [TABLE]
57% of US internet users surveyed had a smart phone. But smart phone penetration among parents of children under 18 was significantly higher, at 74% or above.
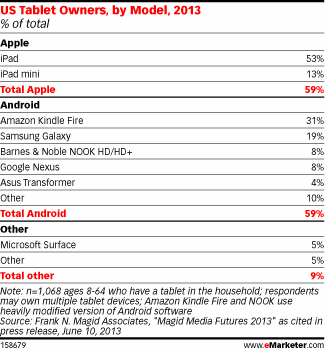
Read MoreAmerican Tablet Owners By Model, 2013 [TABLE]
Android tablets were in use by 59% of tablet-owning households in 2013, the same percentage that reported owning Apple’s iPad or iPad mini.
Read MoreNorth American Publishers That Charge For Mobile Content By Device, October 2012 [CHART]
The iPad saw the greatest percentage of publishers charging for content across publication categories.
Read MoreMobile Platform Development Preferences, Q4 2012 [CHART]
About 63% of mobile developers are very interested in using HTML5 to build their apps.
Read MoreUS Tablet Traffic By Brand, October 2012 [CHART]
98% of web traffic on tablets came via an iPad.
Read MoreMillennials & Their Electronics, 2012 [CHART]
High-definition televisions had the highest rate of ownership among Millennials at 73%.
Read MoreAmerican Tablet Owners By OS, July 2011 & August 2012 [CHART]
By August 2012, the percentage of iOS tablet owners dwindled down to 52%, as Android gathered steam and gained 48% share among tablet owners.
Read MoreGlobal Tablet Shipments By Vendor, Q3 2011 & Q3 2012 [CHART]
The worldwide tablet market grew nearly 7% over the second quarter of 2012. Android sales skyrocketed, while Apple lost share.
Read More


