Posts Tagged ‘iOS’
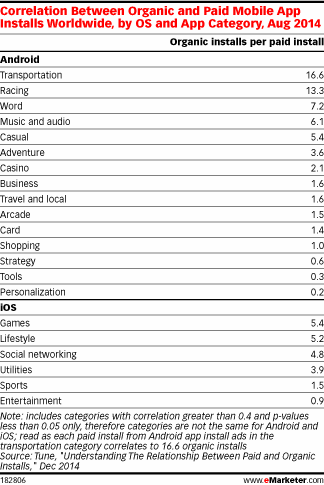
Correlation Between Organic & Paid Mobile App Installs, August 2014 [TABLE]
In most app categories, there is a correlation between paid app installs and organic distribution of the same apps.
Read MoreMobile Ad Behavior By Gender & OS, October 2014 [CHART]
Women are more likely than men to click on mobile ads, and they also sport higher conversion rates and average purchase values.
Read MoreAdvertising Cost Per App Install By Country & OS, Q3 2014 [CHART]
For app advertisers, the cost per install (CPI) is significantly higher on iOS than Android devices.
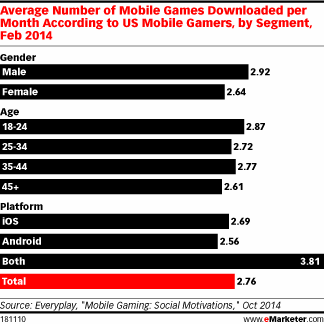
Read MoreAverage Monthly Of Mobile Game Downloads, February 2014 [CHART]
The 18-to-24 age group downloaded the most games on a monthly basis, with an average of 2.87.
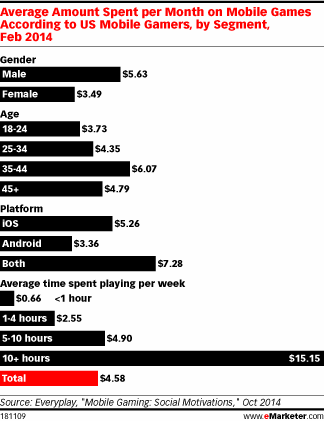
Read MoreAverage Monthly Spending On Mobile Games By Segment, February 2014 [CHART]
The smartphone gaming audience will see faster growth in 2014 and all the way through 2018.
Read MoreMobile Email Use By OS, April 2014 [CHART]
One-quarter of marketers planned to increase spending on email marketing.
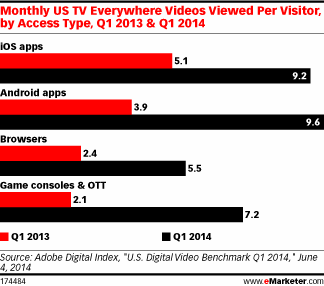
Read MoreMonthly TV Everywhere Videos Viewed By Device, Q1 2013 & Q1 2014 [CHART]
The number of unique TV Everywhere visitors in the US rose 157% between Q1 2013 and Q1 2014 and 49% between Q4 2013 and Q1 2014.
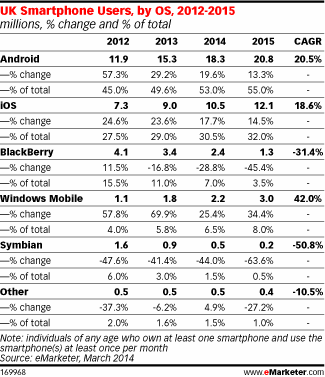
Read MoreUK Smart Phone Users By OS, 2012-2015 [TABLE]
The number of UK smart phone users who own and use an Android phone at least monthly is expected to total 18.3 million this year.
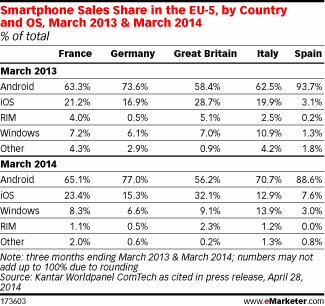
Read MoreSmart Phone Sales Share In Europe By Country, March 2013 & March 2014 [TABLE]
The Google operating system (OS) claimed a 56.2% share of smart phone sales in Great Britain in the three months leading up to March 2014.
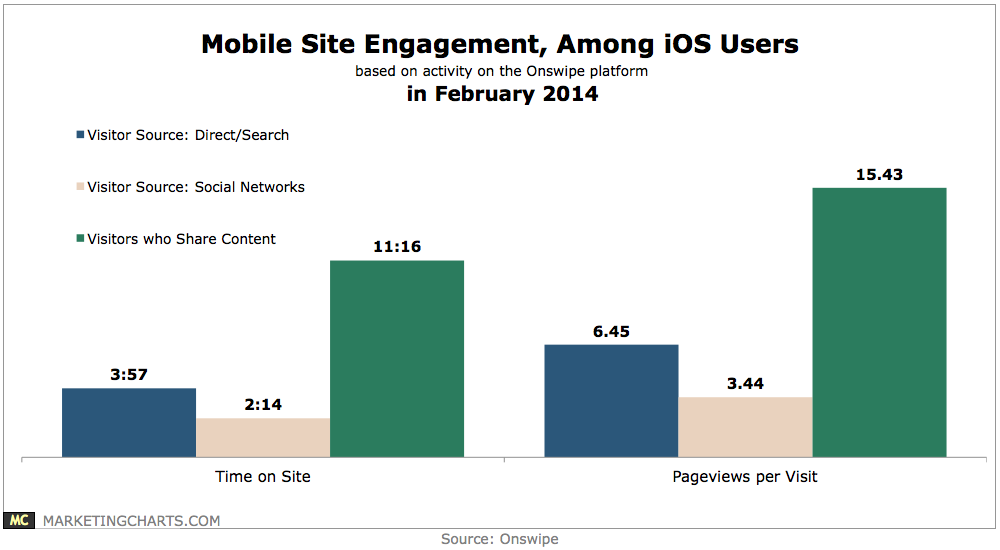
Read MoreiOS Users' Mobile Site Engagement, February 2014 [CHART]
Direct and search-referred iOS visitors to mobile websites tend to be more engaged than those who are referred by social networks.
Read More